
Australia is in the midst of a multi-faceted economic malaise that has resulted in the main economic indicators looking sickly, at best. At the headline level, Gross Domestic Product (GDP) is running at a pretty awful 1.8%, and would have been lower if not for a resurgence in export income linked directly to increased mining activity. Key indicators of economic strength like business investment and inventory levels were down or flat over the last year.
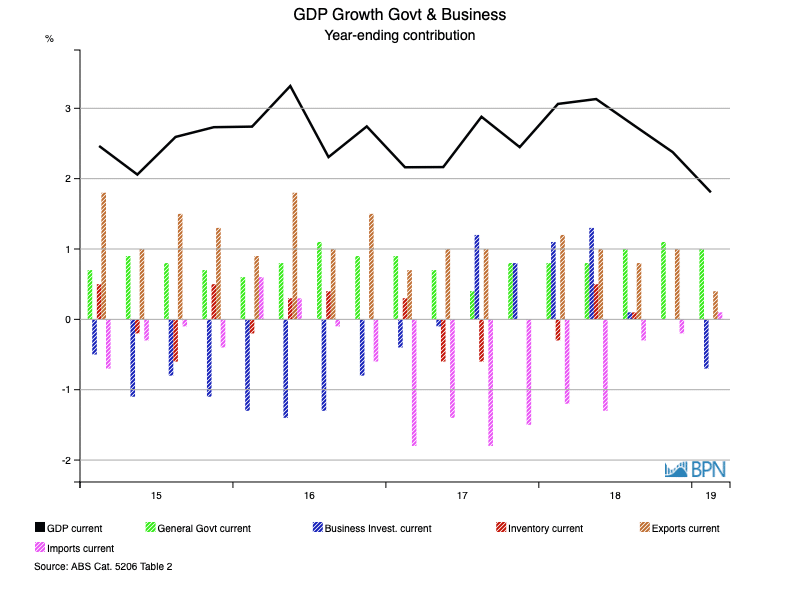
The fall in annual GDP over the last year is significant. From a soft but satisfactory 3.1% over the year-ended March 2018, the decline to 1.8% over the year-ended March 2019, shown in the chart below, is the lowest annual figure in a decade. That is, annual GDP in Australia has not been lower since the September Quarter of 2009, when the 1.4% result was the primary national concern.

To go straight to the dashboard and take a closer look at the data, click here.
Economic activity is, of course, made up of many factors. That means we need to examine what has caused GDP to fall over the last year. We will do this with two charts, over the same timeframe. The first addressing contribution to GDP growth from Government and Business factors and the second showing Household and Building factors.
To go straight to the dashboard and take a closer look at the data, click here.
It is observable that for the year-ended March 2019, GDP was aided by the falling value of imports (+0.1%), after two years in which the growing value of imports was something of a drain on economic growth. General Government expenditure continues to make a contribution (+1.0%), and as outlined at the start of this item, export growth has also been of assistance over the last year (+0.4%).
But on the flipside, business investment turned down sharply, pulling GDP back by 0.7%. That is especially worrying in a low interest rate environment, when today’s business investment is tomorrow’s increased productive capacity in the economy. Flat inventory is not good news. Inventory usually makes a positive contribution to GDP when production is increasing. Stable inventory could well play forward into softer consumption in subsequent quarters for example.
Turning to the Household and Building factors, the chart below shows that growth in household consumption is holding steady, contributing around 1.0% to GDP over the year-ended March.

To go straight to the dashboard and take a closer look at the data, click here.
The chart also shows that over the year, New Dwelling activity declined and detracted 0.2% from GDP as a result, which combined with the 0.1% decline in the contribution of Alterations & Additions shows the relative importance of the housing sector to the total economy.
GDP is a measure of how the total economy is growing, measured in monetary terms. So one of the disturbing elements of GDP at a low 1.8% over the year-ended March 2019 is that it compares against population growth of 1.6% over the same period. That means that on a per capita basis, Australia’s GDP barely grew at all over the course of the year.
It may not be a popular reality with everyone, but it is a fact that on a per capita basis, without net migration over the last year, Australia would likely have slipped into recession.
The ABC’s Stephen Letts and Michael Janda commented on 5th June:
“Excluding the impact of population growth, GDP growth was marginally negative for the third consecutive quarter, further extending the so-called GDP per capita recession.”
This is discussed further, in the next item in this edition of Statistics Count. It is important because a per capita recession can quickly become a full-blown recession.
")

")
")
")