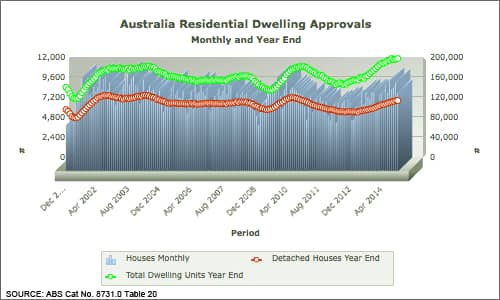
Housing approvals have reached record levels, with total approvals for the year-end November 2014 at 196,769 up 13.3% on the year-end November 2013.
The good news is that the trend in growth looks set to continue into early 2015, at least while interest rates remain low.
Over the same period, detached home approvals totaled 112,899 or 57.4% of total approvals, having peaked in 2002 at 121,229 approvals, when they accounted for 68.5% of total dwelling approvals.
While the solid growth in detached home approvals is welcome news, the record approvals have been delivered by a very substantial lift in approval of Multi Residential dwellings of 4+ storeys. Typically described as ‘apartments’, 48,214 units were approved to year-end November 2014.
The chart below, from the FWPA Data Dashboard shows total dwelling approvals and those for detached houses on a year-end basis, as well as monthly, detached house approvals. The records and growth are clear to see in this data series that goes back to December 2000.
Fig 1

To go straight to the dashboard and take a closer look at the data, click here.
As can be observed in the chart, the rise in high-rise apartment approvals has driven the new record and appears set to continue to be the driver for growth. An increasingly well understood and much commented upon change in the mix of Australian dwellings is at least continuing and may be accelerating.
What is less understood is whether the change in dwelling types is demand driven (where and how Australian want to live) or is more supply driven (how developers and investors prefer to make investments. Some subsequent data and analysis in this edition of Statistics Count addresses the nature of finance approvals for residential property and that provides some clues of relevance. Click here to go straight to that item.
Regardless of the drivers, the shift in dwelling types has at least some impact on the building products used to construct them, as most in the industry understand. This issue is also explored later in this edition, from the perspective of structural softwood sales. Click here to go straight to that item.
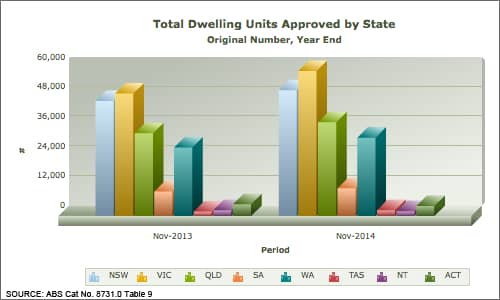
State by state dwelling approval data is always of interest, even if only parochially from time to time. The chart below shows total approvals on a state-by-state basis, for year-end November 2014, compared with those for year-end November 2013.
Fig 2

To go straight to the dashboard and take a closer look at the data, click here.
Over the periods concerned, the greatest growth in approvals was experienced in Victoria, which saw an increase of 18.3% compared with the prior year. Growth in NSW was strong at 9.3%, but was eclipsed by Western Australia where growth totaled 14.5%. This is perhaps counter-intuitive with the reported end of the mining boom, but cashed up miners need somewhere to live when they fly-in fly-out days end.
Queensland saw growth of 13.3% and South Australia 12.5%.
Coming off a low base, Tasmania experienced dwelling approval growth of 30.6%, while the territories both saw declines.
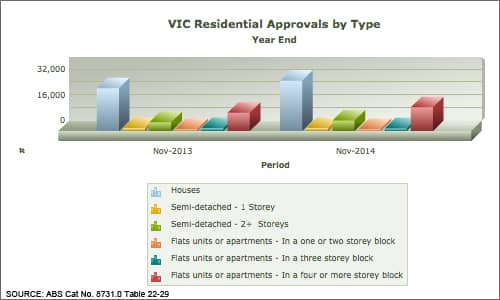
It is worth drilling into the Victorian data further, to see the extent to which the national growth in apartment approvals is reflected in the state that experienced the highest total growth.
The chart below displays the Victorian data for the year ended November 2014 and year ended November 2013.
Fig 3

To go straight to the dashboard and take a closer look at the data, click here.
Growth in approvals of detached houses was a very solid 17.9%, reaching 31,788 total units. However, this was absolutely eclipsed by approvals of Multi-residential dwellings of 4+ storeys, approvals for which grew by 30.0% to reach 14,975 separate units. By way of contrast, NSW detached house approvals grew a similar 17.2%, but the 4+ storey apartment approvals grew just 3.2% over the same period.
It is of course important to remember that dwelling approvals are not dwelling commencements and just as significantly, month-by-month approvals of 4+ storey apartments fluctuate widely because hundreds are approved at a time in a single development.
Nonetheless, the year-on-year data is thought provoking at a national level and instructive, at least, on a state-by-state basis.
To go straight to the dashboard and take a closer look at the data, click here.


