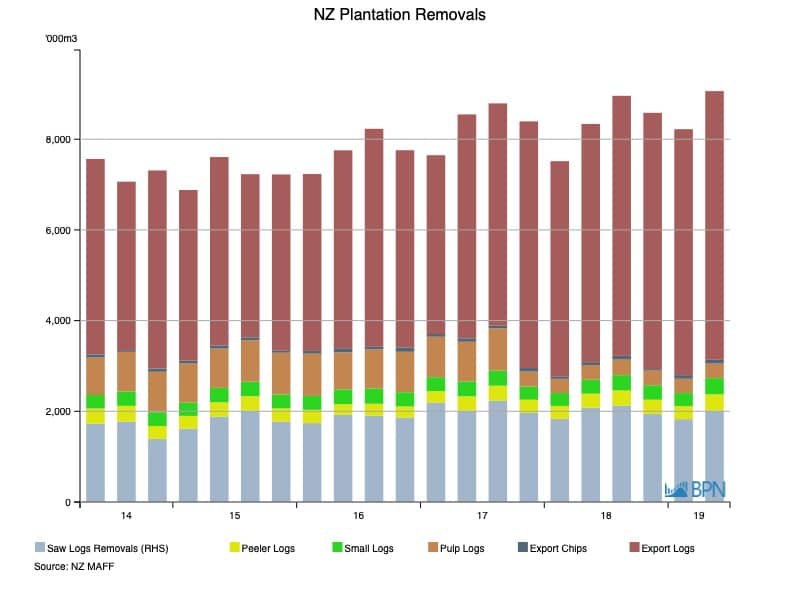
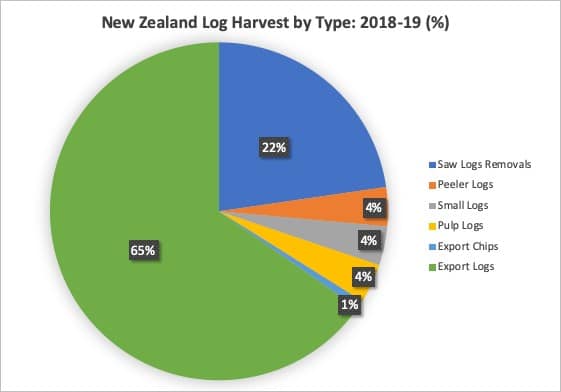
New Zealand’s total log harvest in 2018-19 was 34.822 million m3, a rise of 5.4% on the prior year, as harvest of Export Logs lifted 11.8% to a record 22.736 million m3. As a proportion of the total, Export log extraction lifted to a record high of 65.3% as Saw Log removals declined to 22.7% of the total harvest.
As the quarterly chart shows, the most recent quarter (June Quarter 2019) also saw extractions hit their quarterly peak, which clearly fed into the record annual performance.

To go straight to the dashboard and take a closer look at the data, click here.
Quarterly log extractions totalled 9.061 million m3 in the June Quarter of 2019, up 10.2% on the prior quarter and 8.7% compared with the June Quarter of 2018. The table below displays the details.
|
‘000m3 |
2018Q2 |
2019Q2 |
% Change QoQ |
2017-18 |
2018-19 |
% Change YoY |
|
Saw Logs Removals |
2,081 |
2,015 |
-3.2% |
8,108 |
7,904 |
-2.5% |
|
Peeler Logs |
308 |
358 |
16.5% |
1,217 |
1,300 |
6.8% |
|
Small Logs |
308 |
358 |
16.5% |
1,216 |
1,300 |
6.9% |
|
Pulp Logs |
325 |
321 |
-1.1% |
1,901 |
1,306 |
-31.3% |
|
Export Chips |
62 |
83 |
33.2% |
262 |
276 |
5.3% |
|
Export Logs |
5,254 |
5,926 |
12.8% |
20,333 |
22,737 |
11.8% |
|
Total Extractions |
8,337 |
9,061 |
8.7% |
33,037 |
34,822 |
5.4% |
New Zealand’s log exports are, like those from Australia, destined primarily for the Chinese market, with some shipments to Korea and India also making up the significant majority of its trade.
As is the case in Australia, exports of softwood logs cause persistent concerns for domestic processors, especially as the proportion of the total harvest going to export is rising almost continuously. The harvest may be at record levels, but as the data shows, most of the extra volume is going to export, and less than ever is headed towards domestic sawmills.
The pie chart below shows the destinations of New Zealand’s softwood log harvest in 2018-19.


