

Note: More recent and granular data is available through the FWPA data dashboard. Sign up here today.
Softwood sales in October 2024 show (on the less volatile year-end basis) a continuation of the softwood market, which has declined every month since November 2021. In October, 2024 the year-end sales were 2.68 million m3, down -3.2% over the previous period.
Softwood Chart 1

The monthly data is more positive with sales for October of 245,061m3, up +7.3% over the previous month. Over the past six months, monthly sales have seen four positive months and two negative months.
Softwood Table 1

Source: FWPA Softwood Data Series
Removing the effect of seasonality by comparing sales for the past 5 October periods, we see that monthly sales since October 2022 are relatively steady, with sales ranging from 240,403 m3 (Oct 2022) to 245,061 m3 (Oct 2024) down from October 2020 when sales were 288,775 m3.
Softwood Chart 2

However, this is not a uniform picture across individual product groups.
Softwood Chart 3

Softwood Table 2

Source: FWPA Softwood Data Series
The positives during the period were the Structural Untreated grouping which for the year-ending October 2024 was 707,025 m3 up 3.1% over the previous period and export which was up 18.7% over the previous period.
Softwood Chart 4

Softwood Table 3
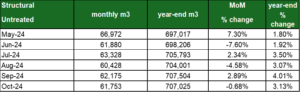
Source: FWPA Softwood Data Series
It is also informative to look at the substitution between the structural untreated and the structural treated product groups.
Softwood Chart 5

Softwood Table 4

Source: FWPA Softwood Data Series
Looking at this on a combined basis, we can see the combined total has remained relatively steady, ranging from 1.351 million m3 year-ending May 2025 to 1.350 million m3 year-ending October 2025. However, emphasising the importance of these major products groups, the % contribution of the combined structural sales group compared to total sales has actually risen from some 48% to 51% in the past 18 months as total sales have continued to soften.
")


