

This article is produced by FWPA’s Statistics and Economics program. More recent and granular data is available through the FWPA data dashboard.
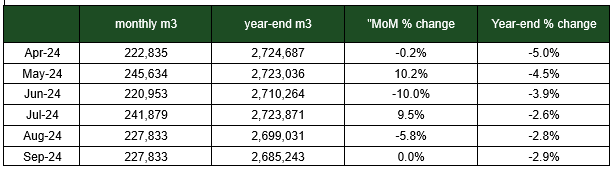
The September 2024 monthly softwood sales were 227,833m3 steady with the previous month. Total sales for the year-ending September 2024 were 2.68 million m3 a drop of -2.9% on the previous period. Basically, there has been a steady decline since a peak in softwood sales in May 2021 at 3.19 million m3.
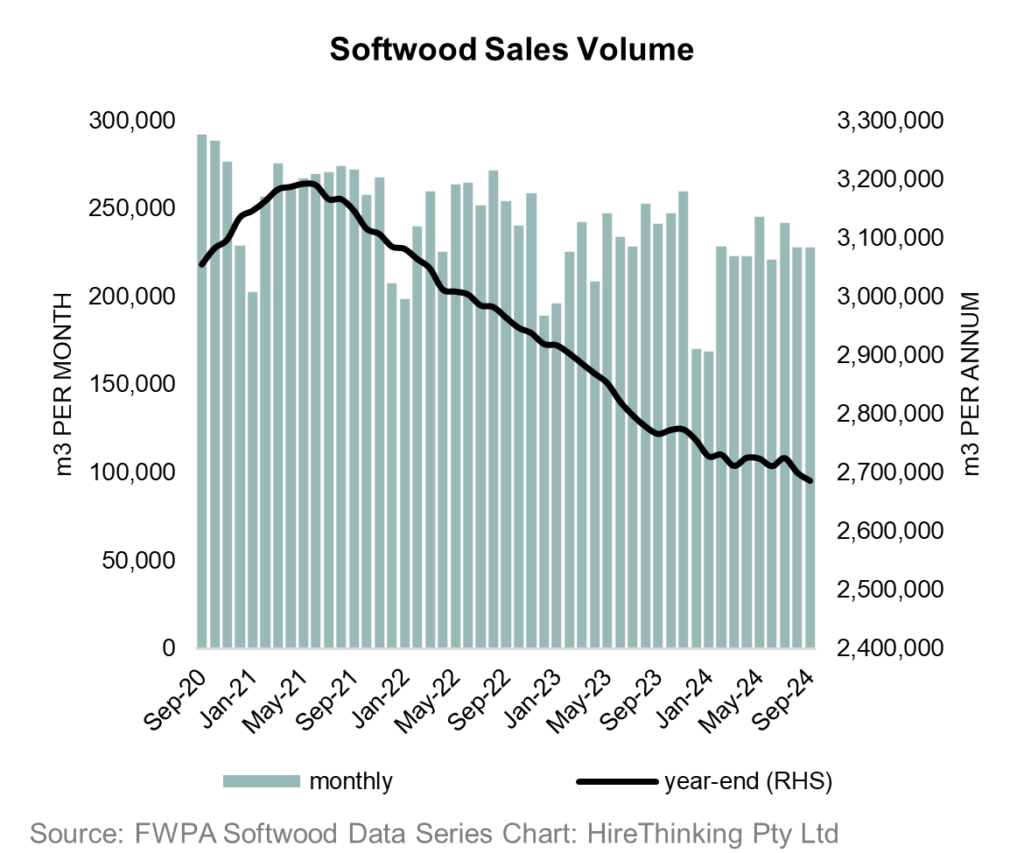
Total softwood sales
Looking at the product categories a clearer picture emerges of the gains made by some product groups, as well as the losses incurred in other categories.
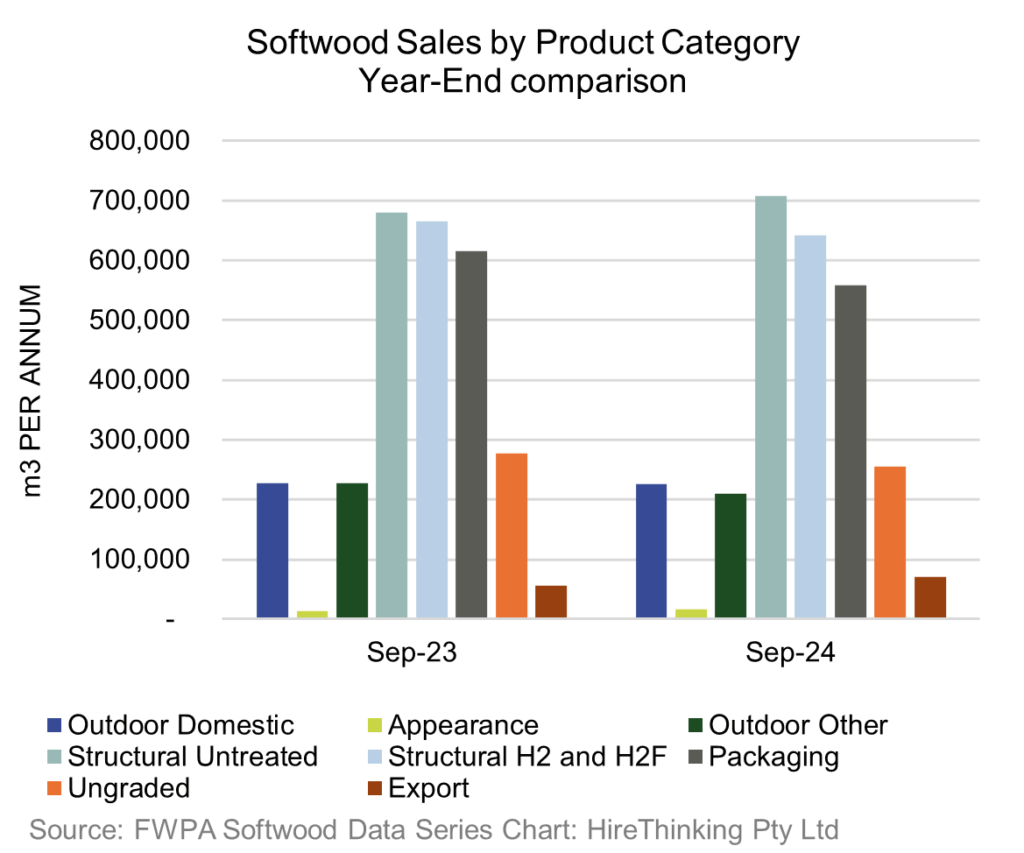
Softwood sales by product category
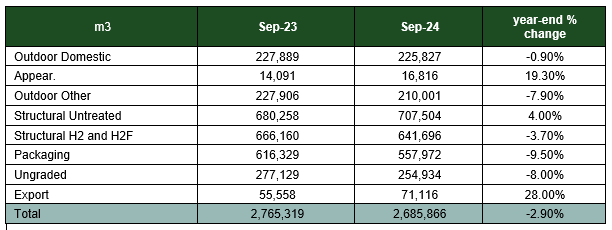
Structural sales for the year-ending September 2024 were 707,504m3, up 4.0% and offsetting treated structural sales of 641,696m3, which were down -3.7% on the previous period.
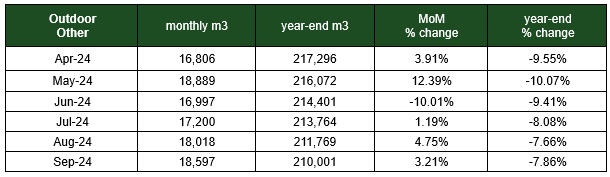
Interestingly, the category of Outdoor Other was down year-ending September 2024 to 210,001 a decline of -7.9%, but on a monthly basis, it has experienced growth for the past 3 months, increasing by 3.21% in September 2024.
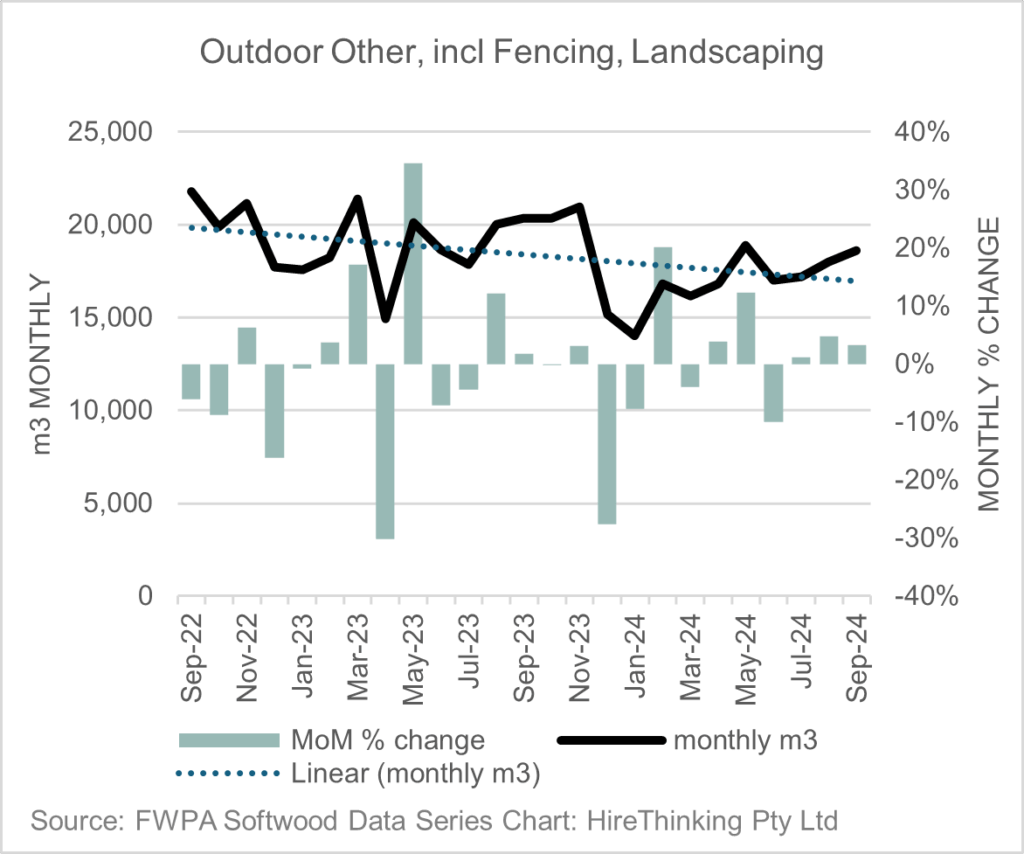
Over the past 6 months, 5 months have been positive with the largest gain in May 2024 of +12.39%.
(FWPA Product Group Definition: All Appearance Grade Timbers, Std Boards & Linings, ROM Boards and Linings, Merch and Laggings Boards & Linings, All solid timber floor board material, Remanufactured Timbers, Furniture Components)
Softwood Weighted Average Prices
Note: More recent and granular data is available through the FWPA Data Dashboard.
A summary table of the 10 product groupings covered in the FWPA weighted average price data series indicates a moderation of prices for 7 out of 9 products during the September 24 quarter and for all products during the previous year.
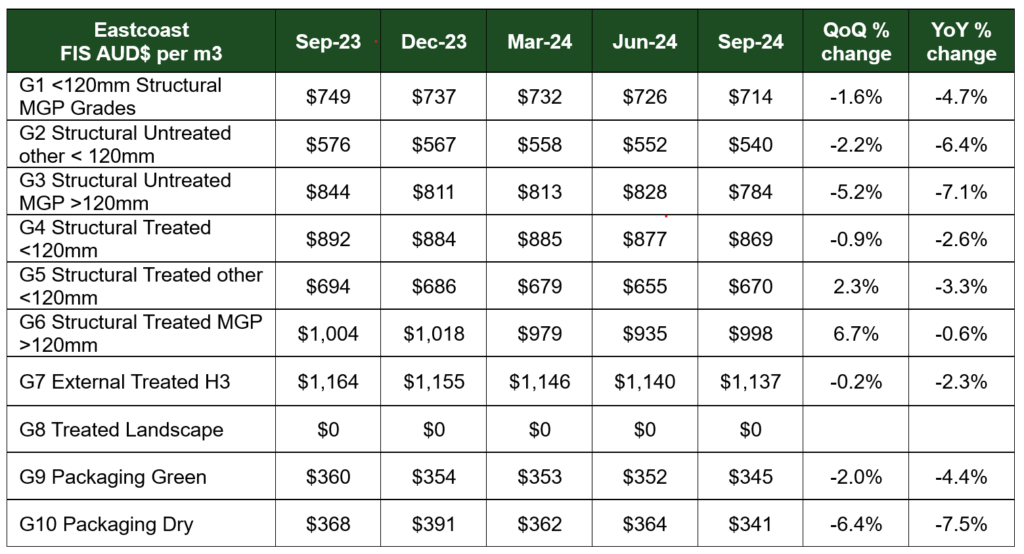
The largest products by sales volume are G1 (Structural Untreated <120mm MGP grades) and G4 (Structural Treated <120mm MGP grades). These products cover most of the structural framing used in the construction of residential detached dwellings..
The G1 weighted average price for the September quarter was $713,99 per m3 FIS. This represented a decline from the previous quarter of -1.6% and over the year of -4.7%, which was down from a peak of $759.26 in March 2023.

(FWPA Product Group Definition: Measure 1: MGP 10 – 90 x 35, Measure 2: MGP 10 – 90 x 45 Measure 3: MGP 10 70 x 35, 45 Measure 4: MGP 12 and MGP 15 – 70 & 90 x 35 Aggregate)
For G4, its treated structural brother, the weighted average price in the September quarter was $868.93 per m3 FIS. This represents a decline from the previous quarter of -0.9% and over the year of -2.6%. Prices for G4 peaked in the September quarter of 2022 at $931.41 per m3 FIS.

(FWPA Product Group Definition Measure 7: Treated MGP 10 – 90 x 35, Measure 8: Treated MGP 10 – 90 x 45, Measure 9: Treated MGP 10 70 x 35, 45, Measure 10: Treated MGP 12 and Treated MGP 15 – 70 & 90 x 35 Aggregate)
In comparison to the declines in the main structural products, the large end section G6 Structural Treated MGP > 120mm was $997.88 per m3 FIS in the September quarter, an increase of +6.7% over the previous quarter. However, as shown in the graph, the same easing pattern is evident over the longer term, reflecting tough market conditions. The same easing pattern is present with a decline from a peak of $1,053.12 per m3 FIS in September 2022

(FWPA Product Group Definition: Measure 12: Treated MGP Grades Large end section incl; 120 x35 & 45, 140 & 190 x 45)
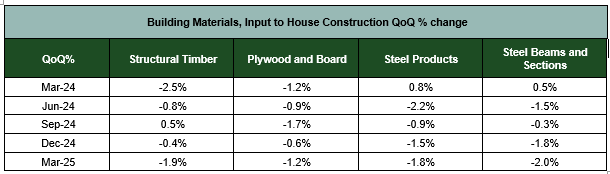
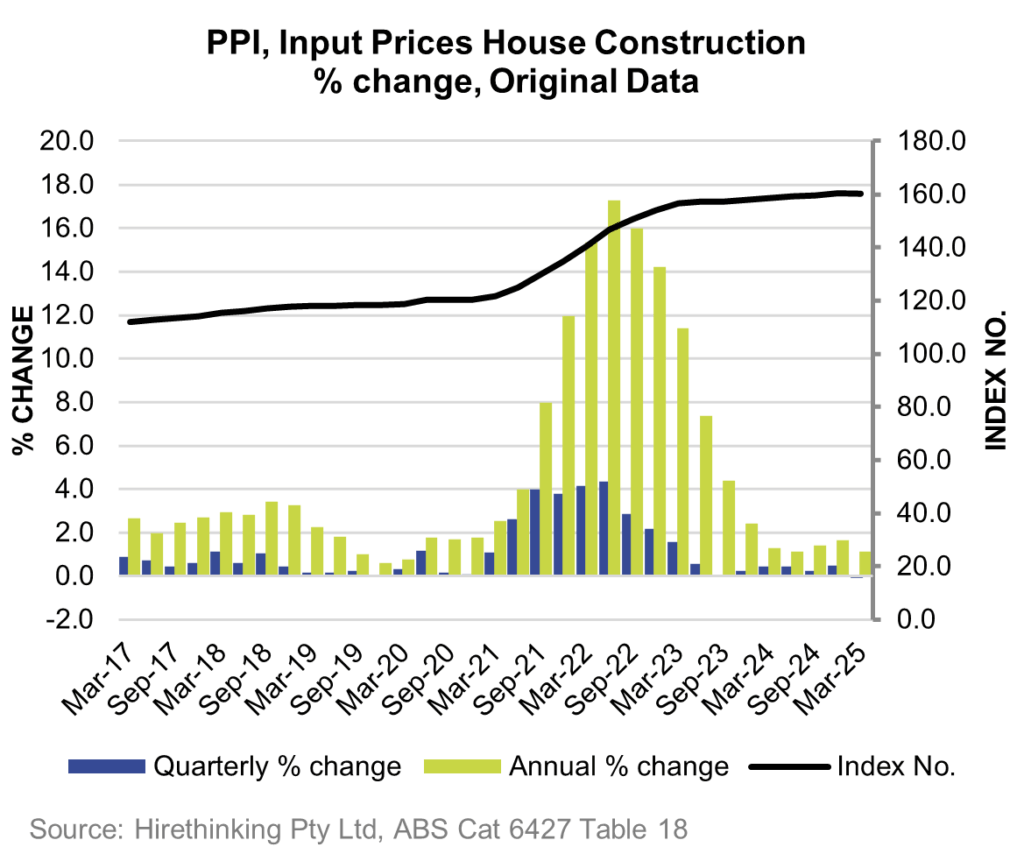
This trend aligns with the ABS producer price index, which provides insights the price movements of building materials in relation to the current structural materials index, showing similar price trends.
The moderating trend in timber prices is also affecting total house building costs, which in the March 2025 Quarter were down -0.1% and up just 1.1% compared to the previous year.
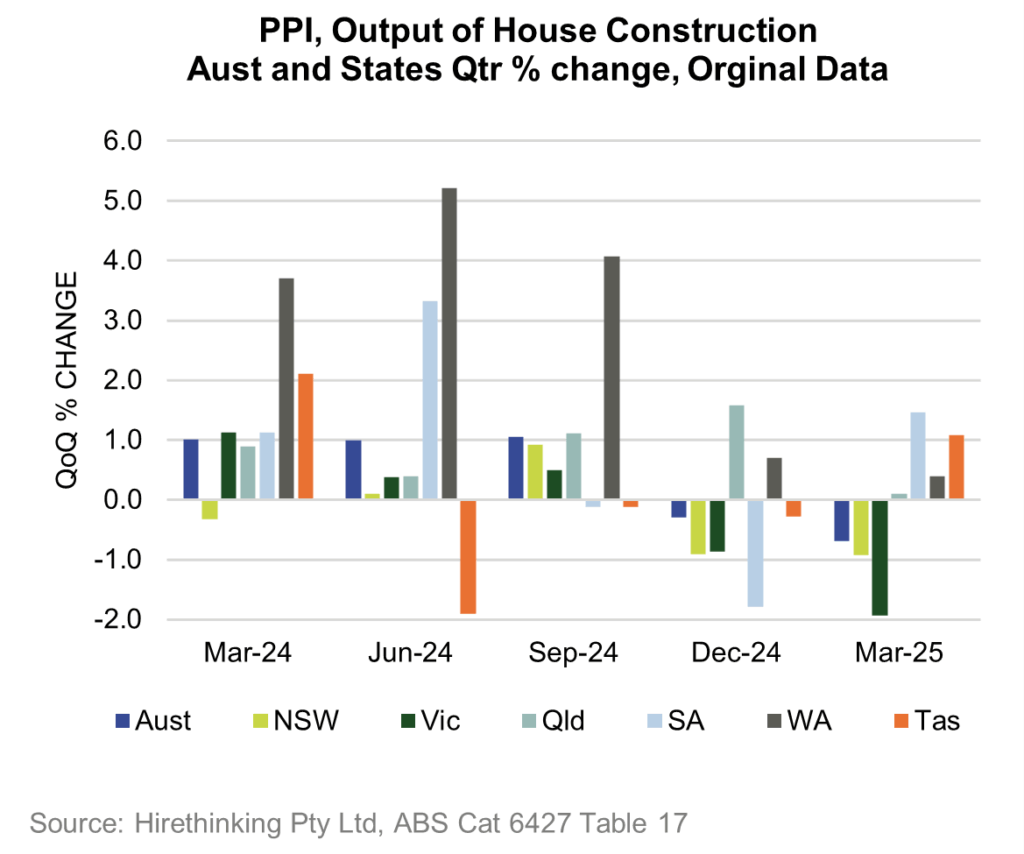
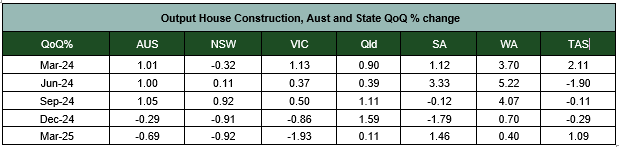
In terms of the output from House Construction (i.e. the finished house), affordability continued to improve in Australia, with a decline of -0.69% in the March 2025 quarter, a similar decline in NSW, and a larger decline in Victoria of -1.93%.
")
")
")
")