
Back in November 2017, FWPA analysed the market for structural framing timbers. That analysis pointed to a likely– but at that time not conclusive – expectation that supply would improve as prices increased and further imports were drawn into the market. At that time it seemed likely the imbalance was temporary, with a market correction and rebalancing potentially underway.
In this updated analysis, FWPA’s Statistics and Economic Manager, Jim Houghton, the supply side pressures are confirmed, but the evidence also demonstrates they are being addressed by rising prices and improving supply, from both local production and imports.
Softwood Sawntimber, Supply and Demand Dynamics Coniferous Imports
Background
In November 2017 we undertook an analysis of the framing timber markets as anecdotal information was suggesting tightening supply conditions. This in turn was impacting the Frame and Truss sector where again anecdotal information was suggesting that the turnaround time was lengthening due to timber supply constraints.
At that time this appeared to be a short term imbalance which would be sorted out by the market through rising prices attracting more supply.
Now some 6 months has elapsed it is timely to see if the expected rebalancing in the market place is underway.
Supply and Demand Dynamics
The imbalance appears to be associated with some increase in demand and also some changes in supply. These can be seen in more detail as follows:
Demand Changes
- Town house development
- Housing approvals remaining stable at high levels
- Alterations and Additions
Supply Changes
- the closure of the Morwell sawmill which historically had been supplying some 9-10,000m3 of finished structural timber and other products into the market each month
- a reduction in import volumes for coniferous softwood (the major sawn product grouping covering structural building materials) from an annualised peak of 657,764m3 reached in March 2011 to a low of 563,409m3 in June 2017.
Dwelling Approvals
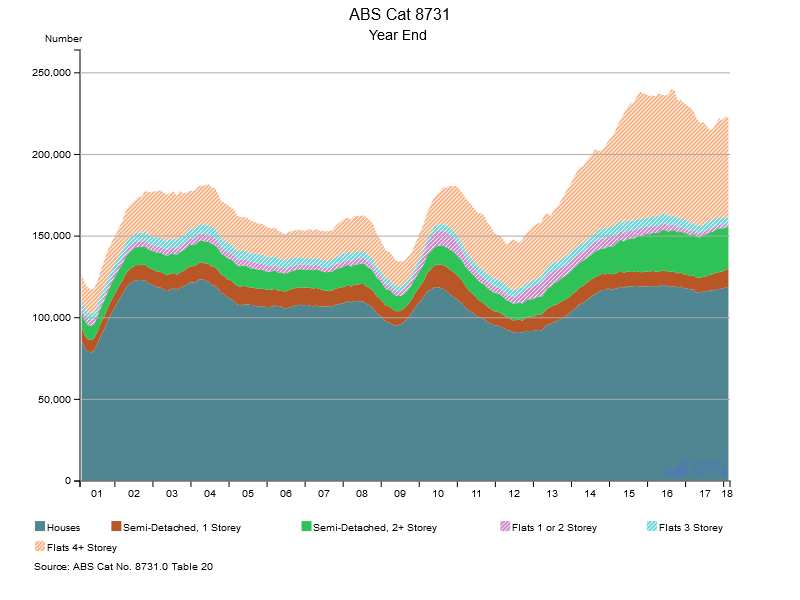
Since 2000 we have seen a big increase in overall dwelling approvals which peaked in August 2016 at 239,986 total approvals. However, that reduction in demand for housing doesn’t necessarily equate to a reduction in demand for timber building materials. As you can see from Chart 1 approvals of detached houses is still holding up well and detached 2 storey (town houses) have doubled. These are all areas where timber is the dominant building material.
Chart 1 Dwelling Approvals
To go straight to the dashboard and take a closer look at the data, click here.
| Description | 2001M02 | 2018M02 | % Change |
| Total Dwelling Units | 127036 | 222721 | 75.3% |
| Houses | 86432 | 119062 | 37.8% |
| Semi-Detached, 1 Storey | 8228 | 10911 | 32.6% |
| Semi-Detached, 2 Storey | 9220 | 25780 | 179.6% |
| Flats 1 or 2 Storey | 3796 | 2175 | -42.7% |
| Flats 3 Storey | 4296 | 4393 | 2.3% |
| Flats 4 Storey | 15064 | 60400 | 301.0% |
Alterations and Additions
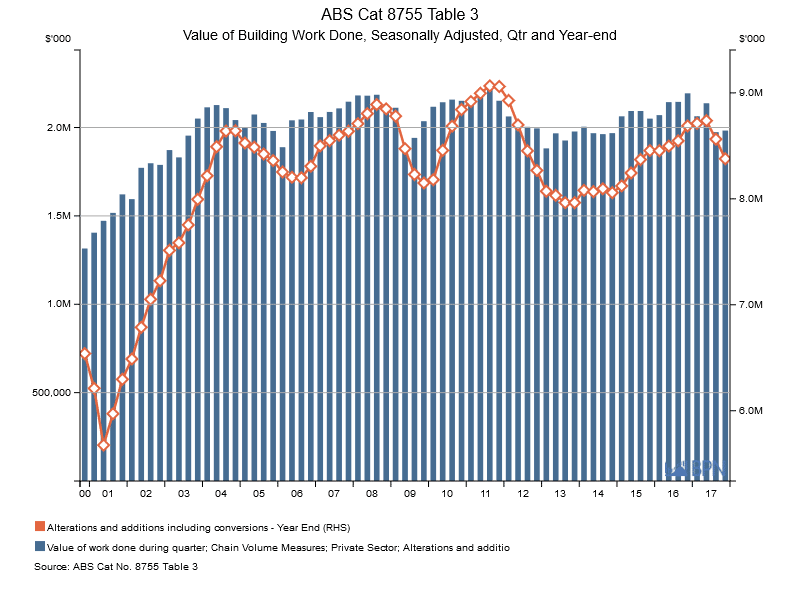
Another area where timber is used is in Alterations and Additions. Whilst the link between $ value of building work done and the use of timber is not precisely known logically changes in the spend on A&A should reflect changes in demand for sawntimber.
Since 2013 this area of building activity has been growing strongly. Although, it should be noted that the past 2 quarters of 2017 have seen activity ease refer Chart 2. So whilst this may have driven demand increases through the previous 4 years the recent softening may have offset some of the continuing demand in houses and town houses.
Chart 2. Alterations and Additions, Value of Building Work Done
To go straight to the dashboard and take a closer look at the data, click here.
Softwood Production
Chart 3
To go straight to the dashboard and take a closer look at the data, click here.
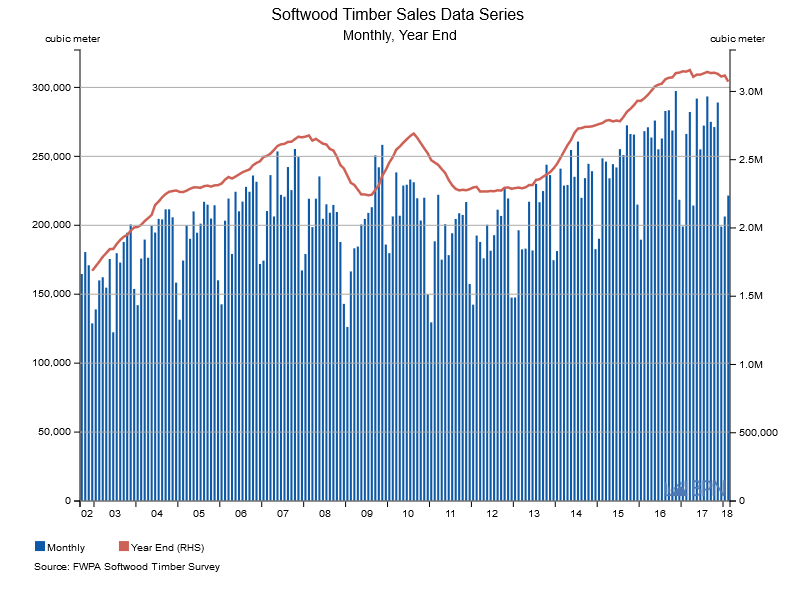
Softwood Sawntimber Sales
The FWPA data aggregation program tracks monthly softwood timber sales. The series aggregates the data provided by 14 softwood sawmills and represents some 90% of Australia’s monthly softwood timber sales.
Reflecting the closure of the Morwell sawmill annualised timber sales peaked in August 2018 at 3.14million m3 and are currently running at 3.07 million m3 as at February 2018. A reduction in local production/sales of some 7,000m3 per month or -2.3%.
Coniferous Imports
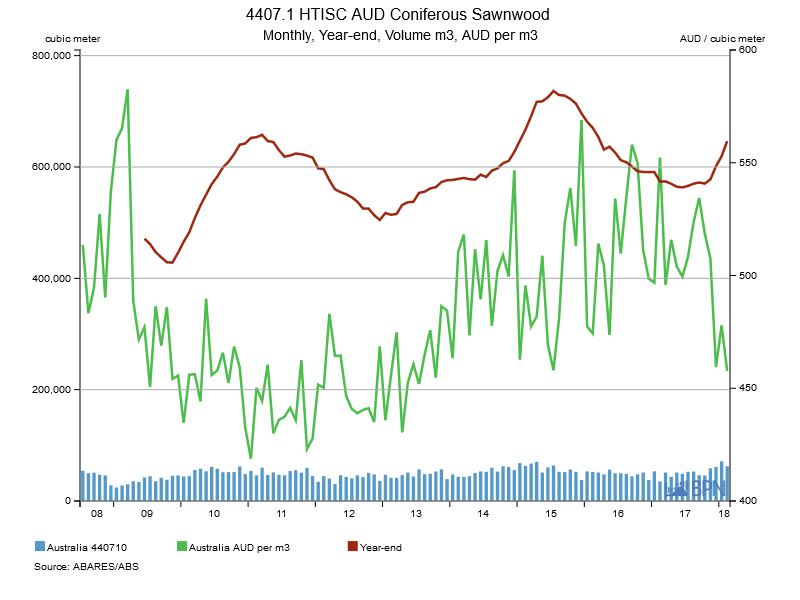
The other area impacting the supply situation is the volume of imported softwood sawnwood.
Chart 4 Coniferous Imports
To go straight to the dashboard and take a closer look at the data, click here.
As Chart 4 shows imports experienced a big increase following the GFC rising from a low annualised volume of 428,789 m3 in October 2009 to a peak of 657,764m3 in March 2011.
At that time prices in the local market were in decline with reductions in softwood structural products such as MGP10 and MGP12 from Dec 2010 to Dec 2012.
As you can see from Chart 5 after this turning point prices started moving up until June 2015.
Unsurprisingly these movements in local prices are reflected in similar movements in the level of imports. From the March 2011 volumes declined to 504,724m3 in Dec 2012. From there imports volumes increased until a new peak of 736,479m2 was reached in July 2015.
Again as can be seen in Chart 5 despite demand conditions remaining strong local prices for structural products declined in June 2015.
This had an immediate impact on import volumes which proceeded to decline every month until June 2017 when the annualised volume dropped to 563,409m3. So effectively during this 22 month period of continued strong demand, due to lower prices, import volumes declined 173,070m3 on annualised basis.
Chart 5 Timber Market Survey
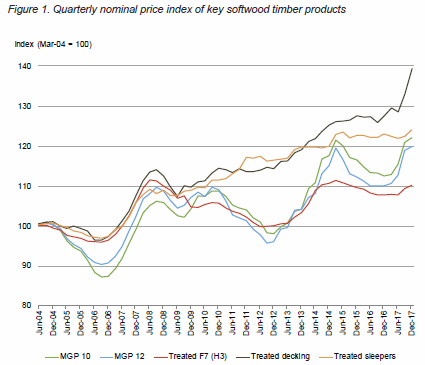
Source: Indufor, Timber Market Survey
From late 2017 local prices have started to move up and this improvement in market returns is also reflected in increasing import volumes.
However, on the surface the AUD price per m3 for imported products shown in Chart 4 doesn’t appear to reflect the same price trajectory. This is misleading as the data covered in the 4407.10 category is summary of all the softwood sawn timber imported products and covers some 19 specific products. These include a number of products or varying value such as treated products and a variety of species such as Radiata, Douglas Fir and Western Red Cedar.
A more accurate way to view the price movement in imports is to look at the major import products codes.
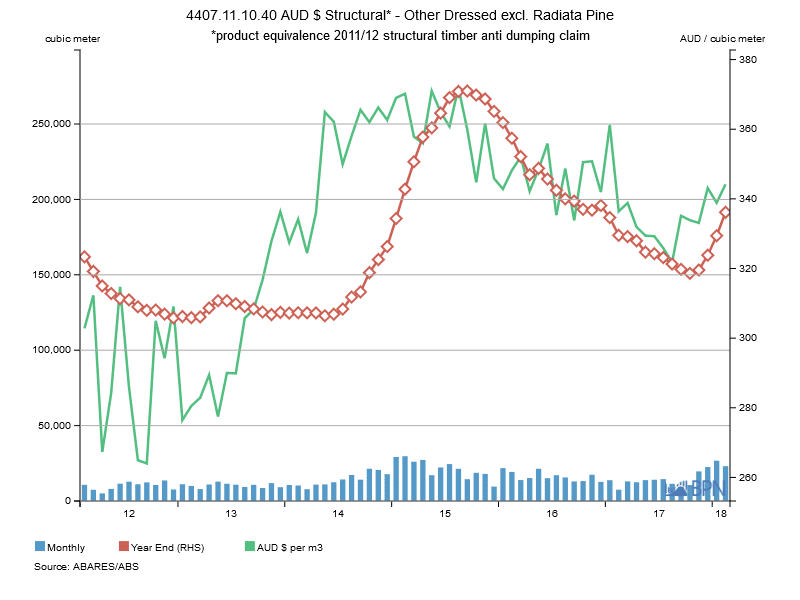
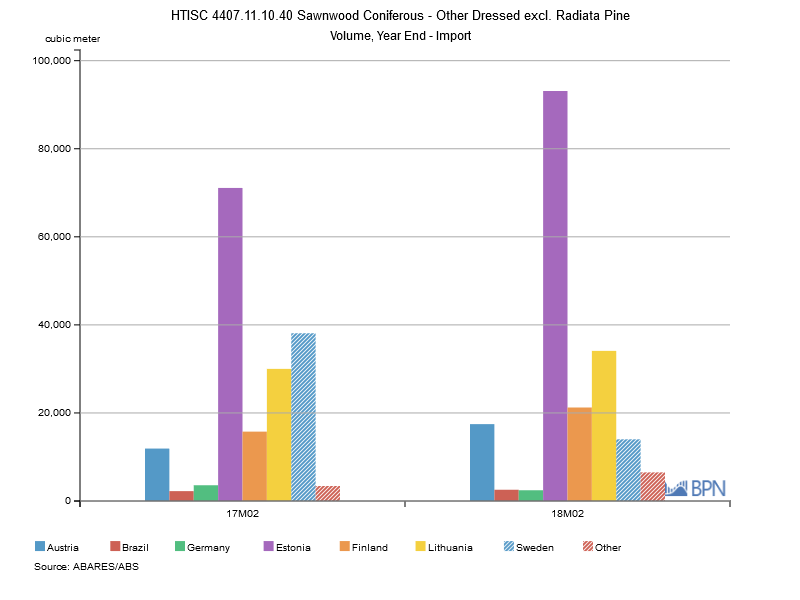
4407.11.10.40
Note: WOOD SAWN: Coniferous Dressed: Planed or Sanded: Other; Coniferous Untreated: Excl; Weatherboards, Radiata Pine
Chart 6 Imports HTISC 4407.11.10.40
To go straight to the dashboard and take a closer look at the data, click here.
To go straight to the dashboard and take a closer look at the data, click here.
Increasing volumes are now happening with increasing prices. Austria, Estonia and Lithuania appear to be the major sources of additional supply.
| 2017M10 | 2017M11 | 2017M12 | 2018M01 | 2018M02 | |
| Monthly | 10578 | 19657 | 22530 | 26760 | 23115 |
| Year-end | 150920 | 153156 | 162973 | 175896 | 191480 |
| AUD$ per m3 | $333.87 | $333.09 | $343.10 | $338.88 | $344.21 |
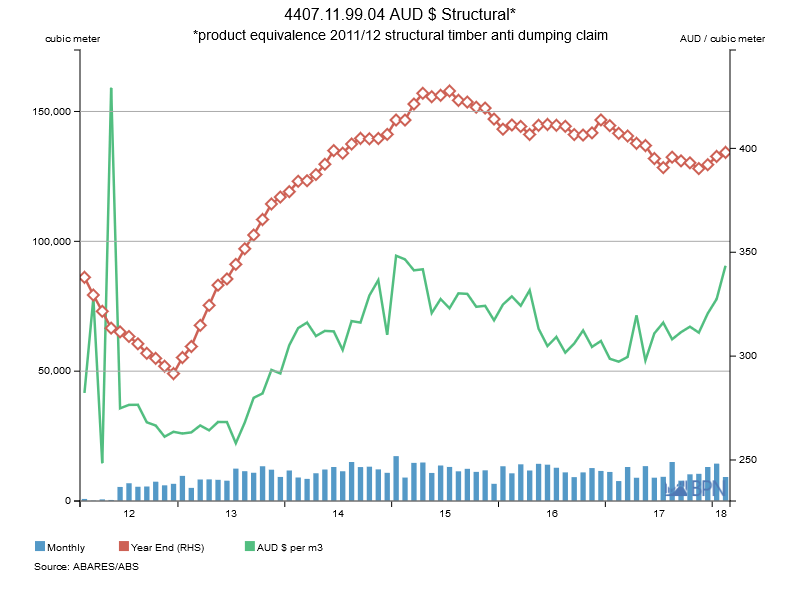
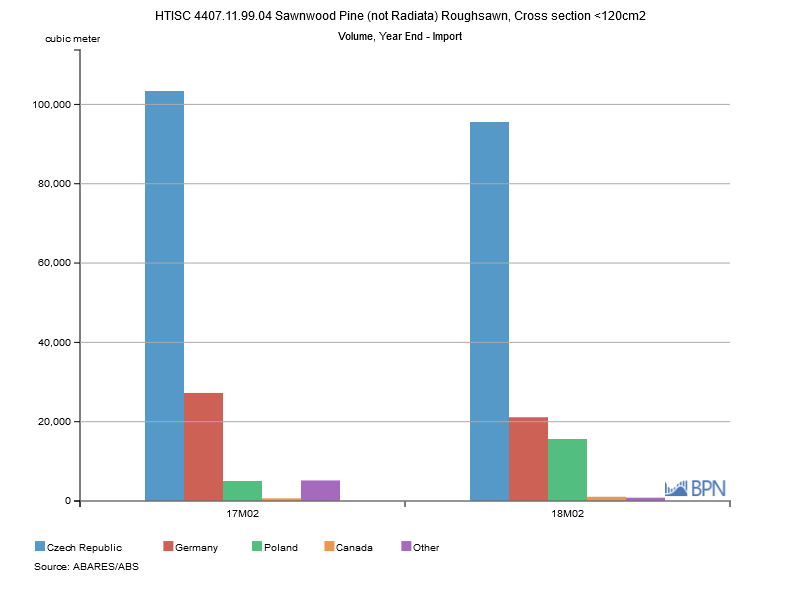
4407.11.99.04
Note: WOOD SAWN: Pine not Radiata Roughsawn: Not planed or sanded: Other; Not cut to size for making staves: Having a cross-sectional area less than 120cm2: Untreated; Pine but not Radiata Pine
Chart 7 Imports HTISC 4407.11.99.04
To go straight to the dashboard and take a closer look at the data, click here.
To go straight to the dashboard and take a closer look at the data, click here.
| 2017M10 | 2017M11 | 2017M12 | 2018M01 | 2018M02 | |
| Monthly | 10288 | 10480 | 13097 | 14400 | 9255 |
| Year-end | 130238 | 128008 | 129503 | 132697 | 134260 |
| AUD$ per m3 | $314.16 | $311.30 | $320.54 | $327.47 | $343.54 |
Volume is now moving up (although below the previous peak) with increases in prices evident. Major source countries are; Czech Republic, Germany, Poland.
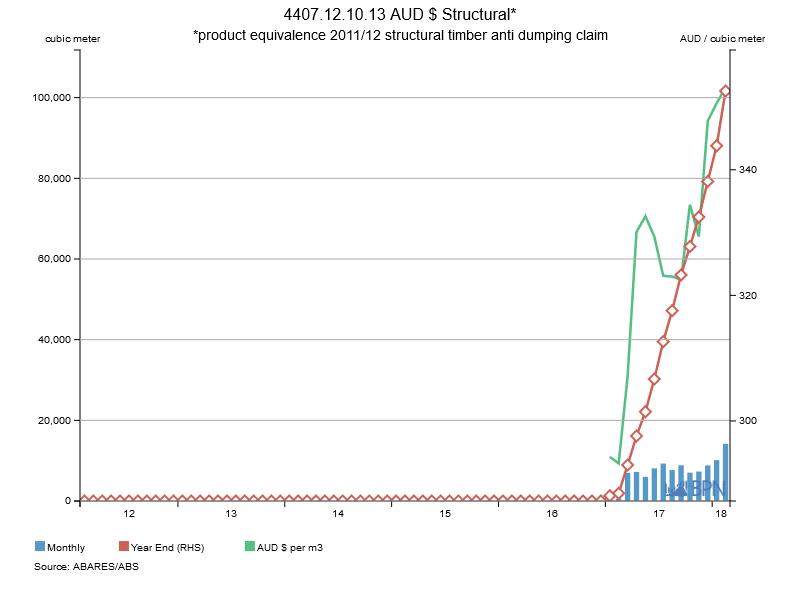
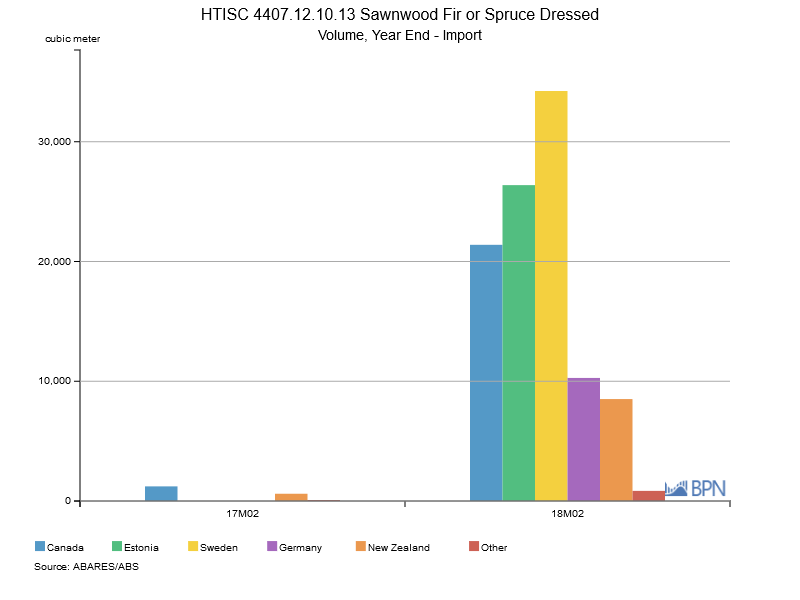
4407.12.10.13
Note: Coniferous wood of Fir or Spruce, Dressed
This is new product category commencing from 1 Jan 2017 and provides greater detail of the type of product being imported. In the past 14 month monthly volumes from 7 -10,000m3 per month
Chart 8 Imports HTISC 4407.12.10.13
To go straight to the dashboard and take a closer look at the data, click here.
To go straight to the dashboard and take a closer look at the data, click here.
Similar to other main product categories annualised volumes are strengthening along with increases in price.
| 2017M10 | 2017M11 | 2017M12 | 2018M01 | 2018M02 | |
| Monthly | 7050 | 7309 | 8821 | 10144 | 14194 |
| Year-end | 63101 | 70410 | 79231 | 88066 | 101647 |
| AUD$ per m3 | $334.45 | $329.37 | $347.76 | $350.60 | $353.09 |
Conclusion
Despite a decline in housing approvals this has mainly been in the multi residential 4+ storey area which is presently dominated by steel and concrete. This compares to areas where timber is strong such as housing approvals which are relatively steady and town houses which have increased. So demand drivers are still strong.
On the supply side we can see that some capacity in the local market has been reduced resulting in local timber sales decline by about 7,000m3 per month in the 2nd half of 2017. Significantly from a peak of 736,479m2 in July 2015 imports of coniferous sawnwood declined to 563,409m3 in June 2017 due to lower local prices.
So in conclusion the tight supply conditions would appear to have resulted from some reduction in local capacity and also the decline in import volumes as a result of lower local prices.
This short term situation now appears to be changing as prices strengthen and supply is starting to increase.
Jim Houghton
FWPA
12 April, 2018
")

")
")
