

The monthly housing approvals data for August proved to be difficult reading. Some of the momentum we had seen in previous months has completely dissipated.
Chart 1

The total number of dwelling approvals fell by 6.0% in August with detached houses down -2.9% and Multi-residential down -10.6%.
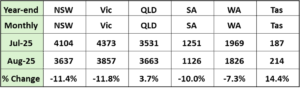
If we look at that by state the monthly data showed negative results for all mainland states except Queensland.
Charts 2

Table 1
Stepping out of the black hole that was August the less volatile year-ending data was still positive
Chart 3

Total dwelling approvals for year-ending August were 186,641 an increase of +12.3% over the previous period. Multi-res was leading the charge with approvals for flats 4-8 storey up +56.1% to 13,632 over the period and Flats 9+ storeys up +35.0% to 26,816 for the period.
Building activity subdued in June quarter
New House commencements (the lifeblood of our industry), were down -6.4% to 26,499 in the June quarter the biggest decline since September 2023.
Chart 4

Interestingly, Houses under Construction were 84,760 well below the peak of 106,117 reached in March 2023 and moving closer to industry capacity which historically have averaged about 60-62,000 Houses under Construction at any one time. However, rather than reflecting gains in capacity with an increasing rate of completions, progress on Houses under Construction was because commencements fell at a greater rate than completions during the quarter.
Reinforcing the view that capacity is an ongoing challenge the value of work in the pipeline continued at elevated pandemic levels.
Chart 5

Table 2

Source: ABS Cat 8752 Table 78
In the June quarter total work in the pipeline was $28.99 billion compared to pre pandemic levels where the average levels were more in the range of $15-16 billion.
Competitions for year-ending June 2025 were 174,030 which is the first year of the national housing accord target to build 240,000 dwellings per year. The shortfall as at June 2025 was 65,970 dwellings which is 27.5% of the target.
Chart 6

Whilst the ambition to build 240,000 dwellings per year is needed to bring supply in line with demand (the central thesis of the FWPA’s More Houses Sooner report 2025) the scale of the challenge is significant. Nick Reece, Lord Mayor of Melbourne was quoted in the AFR commenting that “there were 110,000 homes built in the City of Melbourne up until the year 2024 so about 180 years to build 110,000 homes. And over the next 25 years our target is 120,000 new homes. That’s 180 years to build 110,000 and 25 years to build another 120,000.”
Housing finance – loan repayments remain strong
Recent data published by APRA (Australia’s trading bank prudential regulator) show housing loan repayments by most households remain strong with arrears steady at pre pandemic levels.
Chart 7

This strong position is linked to low unemployment and progress on wages has supported household’s incomes and in turn the ability to service debts.
And in this regard the household debt servicing ratios have continued to improve. The recent Financial Stability Report published in October 2025 highlights that households in most advanced economies have largely weathered the impact of earlier interest rate rises supported by strong labour markets.
Chart 8

*The debt servicing ratio is defined as the ratio of interest payments and amortisations of principal to gross disposable income plus interest payments. It is calculated under the assumption that debt, excluding the effects of loan-level features such as offset accounts and redraw facilities, is repaid in equal instalments over the average loan maturity (assumed to be 18 years). Includes non-profit institutions serving households. Earliest observation is March quarter 1999 and latest observation is March quarter 2025
In Australia, as can be seen in the chart debt to income ratios have declined from recent peaks with the report commenting that “the run-up in housing prices and equity wealth has supported the balance sheets of many households”.
Interest rate direction remains uncertain
Moving to the broader economy the RBA decided at its meeting 29-20 September to keep the cash rate target unchanged at 3.6%. The minutes of the meeting released 14 October observe that “growth in household consumption in the June quarter had been stronger than expected … Moreover, the size of the increase in the June quarter and the fact that consumption had picked up across a wide range of categories over the preceding year suggested that the recovery in household consumption was likely to persist.”
Chart 9

This is good news and reflects the transition in the economy that is needed as public sector spending eases. However, this needs to be tempered by the fact that the expansion in Household Consumption is still below the pre COVID trend line.
Whether this feeds into inflation still remains to be seen but is a concern for the RBA. The minutes of the meeting suggest that “The monthly CPI indicator for July and August had pointed to stronger than expected outcomes in the September quarter. Most notably outcomes for new dwellings and market services inflation components – which contain important information for the quarterly outcome – had both been stronger than expected.” So beware sticky inflation when thinking about the future direction of interest rates.
Another factor in the policy matrix influencing interest rates considered by the RBA is the labour market. This is a critical contributor to capacity in the economy and at the recent meeting was viewed to be “a little tight, though there was considerable uncertainty around this assessment.” That caution was borne out by the recent jump in the seasonally adjusted unemployment rate from 4.3% to 4.5% in September.
Ian Colhoun, Chief Economist, Creditor Watch quoted by the ABC online provides some insight to the relationship between capacity and interest rates. He comments that “capacity utilisation is an estimate of how much of an economy’s potential output is being used. The trends in the capacity utilisation measure are also useful as an indicator of the trend in the official cash rate.”
Using the NAB Capacity Utilisation index (derived from the NAB monthly business survey) overlaid with the RBA Cash Rate target the relationship between tightening capacity and tightening interest rates can be observed.
Chart 10

The NAB capacity index rose further in September to 83.4% the highest level since June 2024.
Mr Colhoun suggests “the strengthening trend would not normally be considered consistent with trend declines in interest rates, if any anything the reverse if the trend continues”.
While that is logical the data is moving fast with the recent uptick in unemployment if it were to persist, may suggest the economy is weaker than forecast and a reduction in interest rates may be necessary.
As with all thing economics time will tell!
")
")
")
")