

Australia’s exports of softwood logs over the year-ended October 2025 totalled 1.491 million m3, a solid 43.5% higher than the prior year, but still significantly lower than peak period that ended in 2020.
In October, exports totalled 173,247 m3, at a weighted price of AUDFob136.62/m3. Formal reporting shows India received 74% of the total, while shipments to China accounted for 23%. The growth of the market to India is also a difference from the previous period when China received almost all Australia’s softwood logs.
Australian Softwood Log Exports by Country: Jan ’20 – Oct ‘25 (m3)

| m3 | China (mainland) | India | Korea | Vietnam | Other | Total |
|---|---|---|---|---|---|---|
| Sep-25 | 40,591 | 111,056 | 2,016 | 5,180 | 1,026 | 159,869 |
| Oct-25 | 40,063 | 127,681 | 801 | 4,188 | 514 | 173,247 |
Over the year-ended October 2025, Australia’s total exports of softwood logs were, totaling 1.491 million m3. Reported monthly exports totaled 173,247 m3 in October 2025.
For exports, softwood logs are differentiated as smaller or larger than 15 cm diameter. The distinction between log sizes was previously more noteworthy, but analysis becomes challenging as monthly export volumes are increasingly erratic, as seen in the chart. If the chart retains validity in current markets, it is in part to show the contrast over time.
Australian Softwood Log Exports by Size: Jan ’21 – Oct ‘25
(‘000 m3 and AUDFob/m3)

Source: ABS and IndustryEdge
Larger logs (diameter >15cm) are dominating Australia’s exports. From 2021, the trend shifted away from favouring exports of the smaller diameter (<15 cm) logs. Larger dimension logs are dominating export data reports and growing strongly from some regions. Although these logs are >15cm diameter at the small-end, industry reports demonstrate they are rarely sawlogs, with most <22cm diameter at the small-end.
Over the year ending October 2025, exports of the smaller logs totalled 0.176 million m3 or 11.8% of the total, while shipments of larger logs totalled 1.315 million m3 (88.2%).
Differentiation of exports based on diameter also allows for some price analysis. Export prices for the smaller logs have remained at a relatively stable price in recent months, moving through a narrow range, while the average price of the larger diameter logs has fluctuated.
In October, exports of the smaller logs tallied an average AUDFob130.43/m3 while the larger diameter logs saw prices at AUDFob138.77/m3.
Are we finally entering the ‘India Era’?
For many years, trade with India has been more desired than delivered, for many Australian materials and resources. Wood products have been no different, with logs considered the logical entry point into a country that has relatively poor logistics, flukey demand and complex regulatory conditions.
Over two decades, log trade had been sporadic and often considered ‘second best’ to the main China market. Recent growth in exports of softwood logs to India has been driven by the necessity to find new markets. However, there is increasing evidence the market is proving itself, at least with improved stability from a volume perspective.
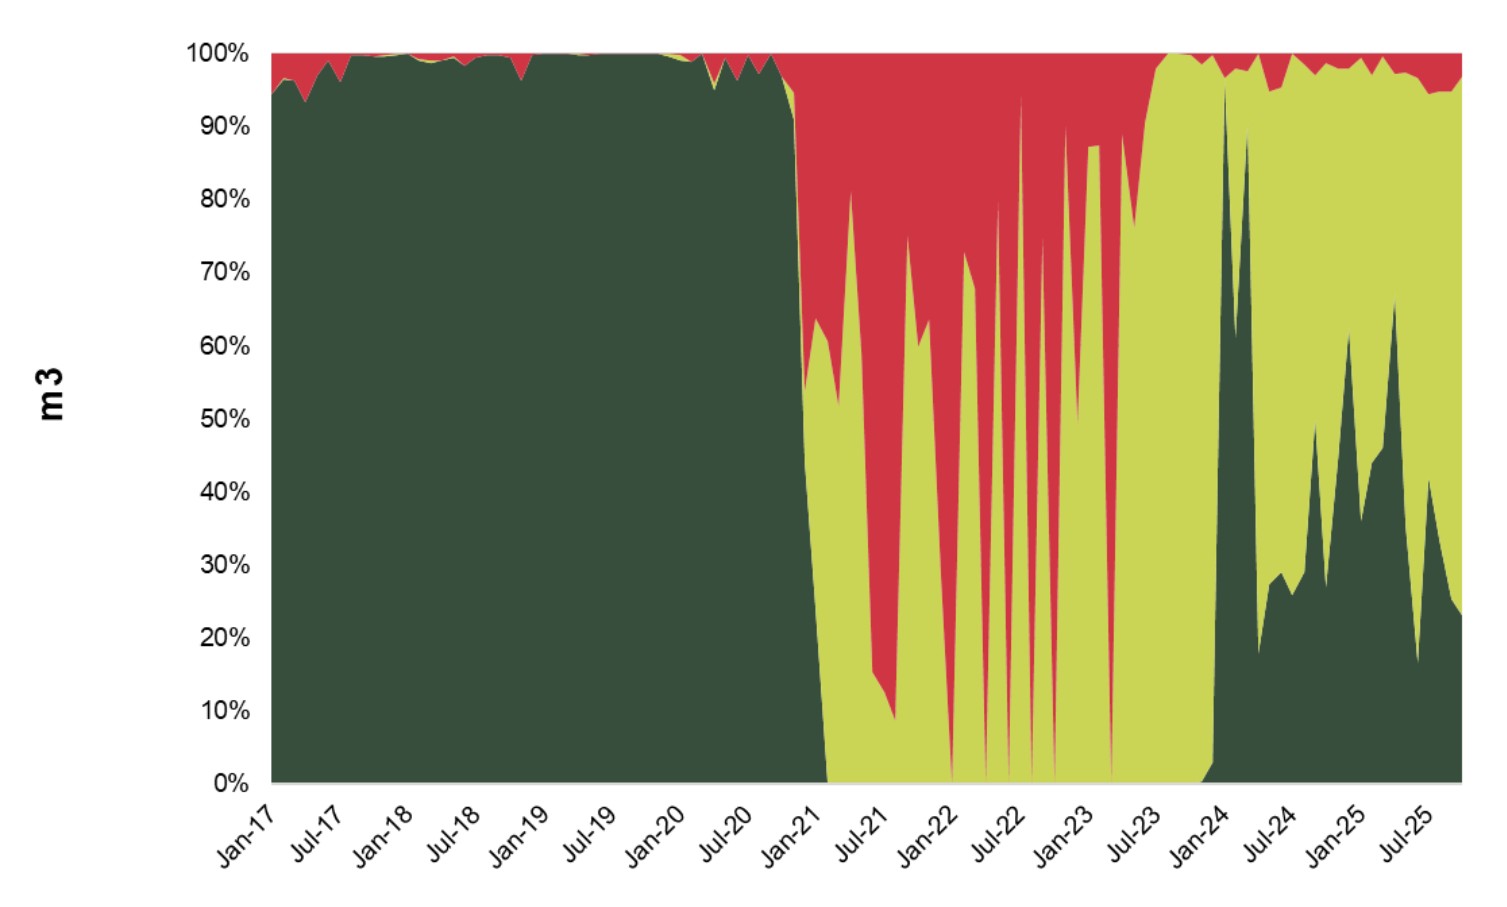
The chart below shows the proportion of Australian softwood log exports going to China, to India and to all other countries. Year-ended October 2025, Australian softwood log exports to India accounted for almost 60% of the total and just over 888,0000 m3 for the year, valued at AUDFob126.2 million, at a weighted average price of AUDFob142.01/m3.
Australian Softwood Log Exports by Country: Jan ’17 – Oct ‘25 (%)

Source: ABS and IndustryEdge
Hardwood Log Exports Down 74% year-ended October
In October 2025, Australia’s hardwood log exports totalled a reported 1,904 m3 at an average price of AUDFob1,010.67/m3. Examined on a full-year basis, across the year-ended October 2025, hardwood log exports were down 74.3%, totalling 10,015 m3.
Australian Hardwood Log Exports by Country: Jan ’21 – Oct ’25 (‘000 m3)

Source: ABS and IndustryEdge
| m3 | China (Mainland) | Indonesia | Korea | Malaysia | Vietnam | Other | Total |
|---|---|---|---|---|---|---|---|
| YE Oct '24 | 26,699 | - | 922 | 173 | 1,169 | 9,983 | 38,944 |
| YE Oct '25 | 4,966 | 117 | 524 | 0 | 366 | 4,042 | 10,015 |
| % Change | -81.4% | - | -43.2% | -100.0% | -68.7% | -59.5% | -74.3% |
The table below shows hardwood log exports by State for the last three months.
Australian Hardwood Log Exports by State: Aug ‘25 – Oct ’25 (m3)
| m3 | Aug-25 | Sep-25 | Oct-25 |
|---|---|---|---|
| NSW | 145 | 289 | 204 |
| RE_EXPORTS | - | - | - |
| NT | - | - | - |
| QLD | 22 | 77 | 339 |
| SA | - | - | - |
| TAS | 150 | 129 | 383 |
| VIC | - | 128 | - |
| WA | 2 | 177 | 977 |
| Total | 319 | 799 | 1,904 |
Source: ABS and IndustryEdge
NZ EXPORT UPDATE
Annual softwood exports up 4.6% year-ended October reaching 22.175 million m3
New Zealand’s softwood log exports are focussed primarily on supply to China, with total exports for the year-ending October recorded at 22.175 million m3 (up4.6% on the prior year), exported at an average price of NZDFob150.94/m3. The weighted average price was 0.8% higher than the previous year.
New Zealand Softwood Log Exports by Size: Jan ’21 – Oct ‘25 (‘000 m3 and NZDFob/m3)

Source: Statistics NZ and IndustryEdge
Over most time periods, the weighted average price for softwood log exports from New Zealand has experienced a limited differential, regardless of dimension, as the table below shows.
| NZDFob/m3 | <15 cm | >15 cm | Differential |
|---|---|---|---|
| Nov-24 | 152.10 | 162.51 | 6.4% |
| Dec-24 | 154.46 | 165.47 | 6.7% |
| Jan-25 | 165.17 | 172.92 | 4.5% |
| Feb-25 | 165.16 | 172.20 | 4.1% |
| Mar-25 | 167.59 | 168.57 | 0.6% |
| Apr-25 | 148.81 | 160.77 | 7.4% |
| May-25 | 144.43 | 160.47 | 10.0% |
| Jun-25 | 136.98 | 148.78 | 7.9% |
| Jul-25 | 128.84 | 142.87 | 9.8% |
| Aug-25 | 142.57 | 150.80 | 5.5% |
| Sep-25 | 141.26 | 149.92 | 5.8% |
| Oct-25 | 142.55 | 152.51 | 6.5% |
ANZ EXPORT SOFTWOOD LOG PRICE INDEX
Average regional export price continues to decrease at USDFob87.24/m3
IndustryEdge’s Australian and New Zealand Export Log Price Index was down in the month of October. The weighted average New Zealand price was down 0.2%, while the Australian equivalent was up 1.3%. The dominance of the New Zealand supply controls the regional weighted average price.
In October, Australia’s export volumes rose 8.4% compared with the prior month, while the New Zealand volume rose 4.6%.
The combined price index value for October trade rested at 81.0335 points, meaning the average log price was around 19.0% lower than the index starting point in January 2017, in cash terms, before accounting for inflation.
The index combines and weights softwood log exports from Australia and New Zealand. It provides a consistent view of the price being achieved for the region’s logs, for the combined trade from Australia and New Zealand, as well as for each of Australia and New Zealand separately.
IndustryEdge’s Australian and New Zealand Log Price Index: Jan ’21 – Oct ’25 (INDEX)
LOGS10

Source: ABS, Statistics NZ, RBA, RBNZ and IndustryEdge
")


