

Across the world, global pulp and paper markets that are the mainstay of the woodchip trade, experienced poor market conditions that saw global shipments of pulpwood decline, into the major markets in Asia.
In this short analysis, drawing on data available from importing country statistics services, we analyse 2025, in the context of previous years, and the current context.
Even as the year-ended, leading commentators were reporting continued softening in paper markets in China and across the globe, more generally. That feeds into uncertainty about the markets for 2026.
However, new environmental restrictions on forestry activities on the island of Sumatra in Indonesia, impacting giant paper producers. The implications will include increased pressure on global hardwood woodchip supplies.
Further afield, storm damage to trees in Sweden in January is potentially very significant for pulpwood supply. There is little doubt aggressive tariff and trade policies and constant changes from the USA are disrupting industrial activity, including the supply of quality softwood chips coming from Canadian sawmills, many of which are currently barely operating.
Geopolitical challenges could play out in either direction: creating or contributing to wood supply shortages or crushing demand for paper and paper products. Either or both options are conceivable in early March 2026.
Hardwood chip markets in Asia
Imports of hardwood chips into the main Asian paper and paperboard producing countries deteriorated in 2025, compared with the prior year. The headline must be mainland China, where reported imports fell 9.8% to 15.6 million bone dried metric tonnes (BDMT).
As the table below demonstrates, Japan’s 2.0% decline in imports continued a long running deterioration. Albeit reported in green metric tonnes (GMT), shipments to Indonesia lifted 2.8% in 2025, but that amounted to just 0.1 M GMT additional, or around 50,000 BDMT.
Though we have elected not to convert the GMT to BDMT in the table, it is calculated shipments to the five countries were equivalent to around 27.1 M BDMT, down from around 28.9 M BDMT the year before.
Major Asia Hardwood Chip Imports: 2023 – 2024 – 2025 (Million BDMT & Million GMT)
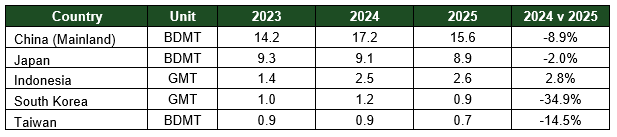
Source: Reporting country statistic services and IndustryEdge
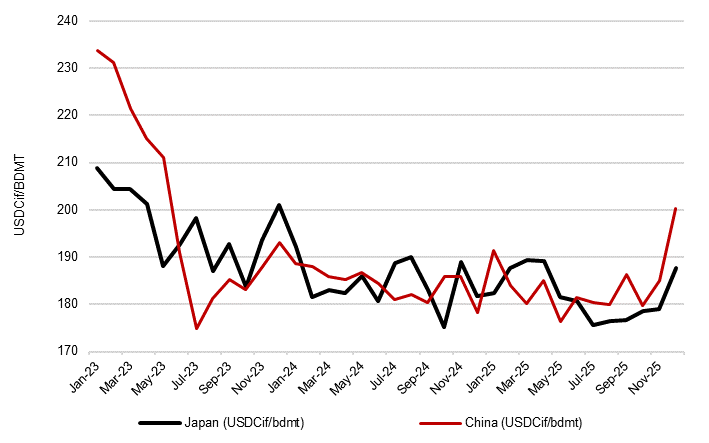
The last three years has seen the weighted average price of hardwood chips delivered into the main markets – China and Japan – fall reasonably steeply until the middle of 2023, since when they had continued to trend down to average UUSDCif182.50/BDMT in 2025. As the chart below shows, the weighted average price for both countries lifted in December, due in large part to a weakening US Dollar.
Average Monthly Hardwood Chip Import Price: China & Japan: Jan ’23 – Dec’ 25 (USDCif/BDMT)
Vietnam dominates hardwood chip supply to China
In 2025, Vietnam delivered 70.8% of China’s hardwood chip, amounting to 11.1 M BDMT. Although that was lower than the 12.2 M BMDT delivered in 2024, Vietnam retained its market share, with Australia the only other supplier in double figures (17.9% of the total).
China’s Top 10 Hardwood Chip Suppliers: 2023 – 2024 – 2025 (BDMT & %)
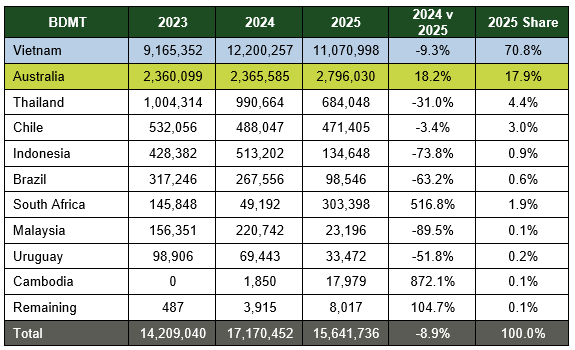
Source: China Customs Service and IndustryEdge
It is a curious aspect of the hardwood chip supply to China that the two major suppliers (Vietnam and Australia) are also routinely the most price divergent. The chart below demonstrates this experience, which arises from the higher pulp yields, quality of supply, improved brightness and freight costs of Vietnam and Australia.
In December 2025, the spread from Vietnam (USDCif186/BDMT) to Australia (USDCif235/BDMT) was USD49/BDMT.
Selected Country Hardwood Chip Import Prices to China: Jan ’23 – Dec ’25 (USDCif/BDMT)

Source: China Customs Service and IndustryEdge
Japanese supply of hardwood chips is more evenly spread
Although it accounted for 48% of hardwood chip deliveries into Japan in 2025, its dominance is far less settled than in the larger Chinese market, because countries like Thailand (12.6%) and South Africa (12.8%), combined with Australia, Chile and others to provide an alternative supply.
There is a strategic supply diversification strategy at play in the Japanese import profile. It imports relatively large volumes of lower-priced fibre to sit alongside the Vietnamese cost advantage, but is clearly harder to disrupt because of the breadth of sources. The table below provides the detail.
Japan’s Top 10 Hardwood Chip Suppliers: 2023 – 2024 – 2025 (BDMT & %)
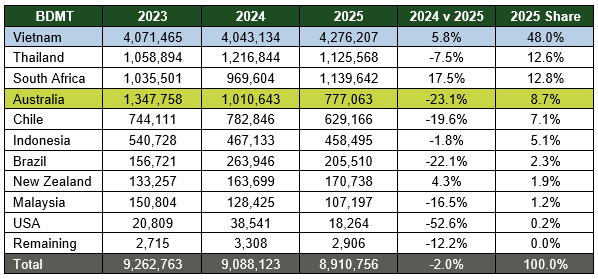
Source: Japan Customs Service and IndustryEdge
Because supply is more varied, the lowest-priced imports to Japan will not always be from Vietnam. However, the highest priced is invariably from Australia (occasionally joined by Chile) and it is useful comparatively to show a chart similar to that for China.
Selected Country Hardwood Chip Import Prices to China: Jan ’23 – Dec ’25 (USDCif/BDMT)

Source: Japan Customs Service and IndustryEdge
For hardwood chip deliveries to Japan, it is clear the Australian supply faces some ‘moments’ on price. Compared to China, those moments are far more regular and more noticeable.
In many respects, this runs counter to historic expectations of the global hardwood chip market – China was expected to experience more varied pricing. As much as the variable Japanese pricing reflects some occasional challenges, it also reflects the complexity of any country’s market. Japanese producers use hardwood chips for several purposes, receiving supply from multiple sources. This is reflected in the Australian price experience.
")
")
")
")