
An update from the desk of FWPA’s Statistics and Economics Program
In the last ten years, between 2014 and 2024, the Australian agricultural sector has experienced steady growth of 4.7% per year. The gross value has increased from around $56 billion in 2014 to $88 billion in 2024. The agricultural industry sub-sectors include crops, industrial crops, horticulture, livestock, livestock products, fisheries, and forestry.
Livestock and livestock products are the largest subsectors, accounting for, on average, 40%—45% of total agricultural production, or $30 to $35 billion. Crops and horticulture are the second largest, valued at around $30 billion on average. Meanwhile, fisheries and forestry account for 7% of total agricultural production. Between 2014 and 2024, on average, the gross value of fisheries was around $3.1 billion, and forestry was $2.4 billion.
Gross Value of Farm, Fisheries and Forestry in Australia 2014-2024

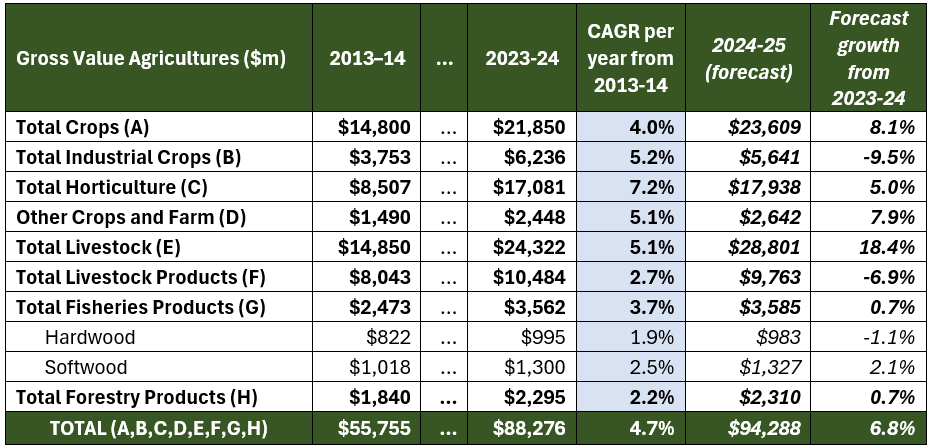
The period between FY 2022-23 and FY 2023-24 was considered the highest growth rate in livestock gross value. Cattle and lamb (including sheep) were key livestock valued at around $13.3 billion and $4.4 billion, respectively. Barley and wheat are the main components of crops.
During FY 2022-23, the gross value of barley and wheat reached the highest at $4.8 billion and $16.8 billion, respectively. Meanwhile, wool and milk remain key elements, accounting for 75%-80% of the total livestock products (Table 1).
In the forestry sector, the gross value during the period indicates that softwood grows 2.5% per year and hardwood 1.9% per year.
Detail Gross Value of Farm, Fisheries and Forestry Australia 2014-2024
American Tariffs on China’s Key Products and Canada’s Timber Products
The global trade will face some challenges with the new administration in the United States. The additional 10% tariff on all Chinese goods entering the US market will impact the US economy and global trade in general. First, as businesses pass through the costs of exports to consumers, the price of popular goods will immediately adjust. As seen in Figure 2, sourced from The Economist, laptops and smartphones will adjust their prices. The combined export value of those products in 2023 was nearly 80 billion US dollars.
Laptops from China account for 60% of the global and 25% of the US markets. It will be challenging for the US to find alternative suppliers. Moreover, the laptop is classified as a complex product, making relocation to production expensive. The consequences are inflationary and will increase prices in the US and global markets.
Most valuable export goods from China to US and their complexity

Product complexity from China to the US

Related to the timber industry, increasing tariffs on Canadian products, including timber, will also disrupt the global timber trade. In 2024, Canadian exports of softwood timber to the US were the lowest in a decade due to duties applied by the US. They accounted for around 25 million m3, which dropped to almost 10 million m3 compared to the level in 2015.
Additional tariffs will increase the price. In the short term, the US will find other suppliers, and Canada will find other markets. This will create an adjustment in the market, which increase the cost and then the global price of timber. In the long term, when the market reaches stability, the price will be in the new equilibrium, which is higher than before. Figure 3 shows historical data on the Canadian export of softwood timber to the US.
Imports Softwood timber from Canada to the US

Figure 4: Imports Softwood timber from Canada to the US Sources: The Economist, USDA, Parliament of Canada.
Subscribe to updates from FWPA’s Statistics and Economics Team:
To receive regular updates on data and analytics relevant to the forest and wood products industry, you can subscribe via this link.

")
")
