

As mentioned in previous Statistics Count articles – forecasts are in the eye of the beholder. Dwelling investment has been volatile against a background of difficult market conditions. Significant negative quarters at the end of 2023 were followed by 3 positive quarters in 2024. The recent December quarter GDP covered in more detail below showed another negative contribution.
However, the overall trend in 2024 was up and the budget papers forecast this to improve. Commenting that “Dwelling investment is expected to accelerate from 2025–26 in response to robust housing demand and an easing to both supply-side constraints and financing costs”.
The forecasts for 2025/26 are 5.5% with even stronger growth of 7.5% expected in 2026/27.
In terms of specific housing related funding initiatives a further $800 million was announced to expand the Help to Buy program. Also of interest was an announcement of $54 million to increase supply and adoption of prefabricated and modular housing construction.
December 2024 GDP shows the economy still has a pulse
- GDP rose +0.6% in the December quarter up +1.3% for the year. Not stellar numbers given historic trends for the Australian economy have seen growth at 2.5-3.0% per year. However, there were a number of promising signs within the data.
- GDP on a per capita basis was positive at +0.07% following 7 consecutive quarters of negative per capita growth. This is important because it means growth is starting to come from the traditional drivers not just population growth.
2.1 GDP Per Capita Seasonally Adjusted

In particular, key contributors to growth were household spending(+0.2ppts) and private investment (+0.1ppt) supported by government spending (0.1ppt) and public investment (+0.1ppt).
Household spending on a quarter on quarter % basis was up +0.42%. This was not at the expense of savings with the Household Savings Ratio which increased from 3.6% in September to 3.8% in December. The extra spending has been funded by the flow through of tax cuts from July 2024 and small but positive increase in compensation of employees (+1.0%). In addition, as inflation falls marginal gains in income are not being eaten up by increased prices.
Inch by inch (or should that be centimetre by centimetre) living standards are improving. Real Household Disposable Income per capita in December 2024 was back to levels in December 2020 and nearing pre pandemic levels of March 2020. While still below the pre-pandemic trend line it is pointing in the right direction.
2.2 Real Household Disposable Income

Finally, while no surprise for the timber industry, investment in new and used dwellings and alterations and additions remained underwater.
2.3 Private Gross Fixed Capital Formation Dwellings

After several quarters of positive activity investment in new & used dwellings in the December quarter was $20.274 billion (down -0.1 on the September quarter) and Alterations & Additions was $13.376 billion (down -0.9% on September).
Nevertheless, these small signs of life in the overall economy suggest the next GDP release for the March quarter will show further improvement as the impact of the reduction in official interest rates by 0.25% on 18 February flows through.
Housing Approvals – a sniff of optimism in January
The year-end approvals data for January confirmed early commentary that the current housing cycle has turned. Total dwelling approvals year-ending January were up 5.9% to 173,586, albeit well below the peak of 232,016 reached in September 2021. Large apartment projects 9+ storey were the big mover up 15.7% to 23,226 year-ending January 2025. Significantly for the timber industry detached houses were up 8.7% to 110,688 for the period.
Looking at the more volatile monthly headline data the picture is more measured but still positive.
2.4 Dwelling Approvals Monthly

2.5 Dwelling approvals seasonally adjusted

Over the last 6 months approvals for detached houses have seen 3 up months and 3 down months with an average of 9380 approvals per month which compares favourably to the average for the previous 6 months (Feb 24 to Jul 24) of 9169 approvals. Total dwelling approvals have been even stronger averaging 15375 over the last 6 months compared to 13782 over the previous 6 months (Feb 24 to Jul 24).
The State story is also positive for all States except Tasmania which was down -13.6% to 2406 dwelling units year-ending January compared to the previous period.
2.6 Total Dwelling Approvals by State

The big bounce back in WA is significant with approvals running at 21505 for the year-ending a gain of 47.9% on the previous period.
CBA Senior Economist, Belinda Allen quoted in the AFR said “the pace of growth and the number of building approvals were trending higher by the increase in apartment approvals and the pace of recovery would pick up. We expect further improvement in 2025 driven by improved capacity and costs, as well as the interest rate cutting cycle”.
All good signs but clearly a long way to go particularly in the context of the National Housing accord with a target of 240,000 dwellings per year.
Is Australia’s housing crisis contributing to stagnating living standards?
As discussed earlier in respect to the December 2024 GDP, living standards, as measured by real per capita household income, is now starting to recover post COVID, and is tracking about where we were at in December 2019.
An interesting conversation unfolded at a recent Business Forum regarding the differences between the level entrepreneurship in the Australian vs the US Economy and possible links to the value of housing stock.
The observation was made that in the US, the total housing stock is slightly less than twice the size of its economy ($50 trillion housing stock vs $29 trillion GDP). In Australia the value of the housing stock is four times as large as the economy ($11 trillion housing stock vs $2.8 trillion GDP).
Paul Schroder, CEO, Australian Super commented at the Forum “We have all this money in our domestic houses, and we are not backing business. We are not creating new things. We are not driving productivity”.
As we constantly hear from economic commentators – this is important because living standards and real incomes are ultimately determined by productivity i.e. how efficiently labour produces goods and services. A useful insight to keep an eye on.
Follow the money – Housing Finance continues to grow
As activity levels in housing start to improve lending is also on the move. The lending indicators for the December quarter saw total loans for the period increase 16.0% to $87.23 billion compared to the December quarter 2023 when total loans were $75.20 billion.
2.7 Housing Finance Value annual % change

ABS Lending Indicators have now moved from a monthly data series to a quarterly data series. So while not as timely more detail is available particularly in respect to the number of loans approved which is a strong indicator of changes in activity levels as we can see in the following graph.
2.8 Number of loans by purpose

Looking at Owner Occupier loan approvals for construction of new was up 2.9% for the quarter and 3.5% compared to the December 2023 quarter.
2.9 Number of loans
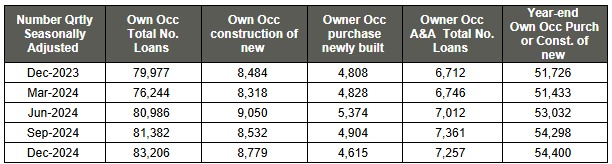
Overall total loans approved for owner occupiers were 83,206 an increase of 2.2% on the previous quarter and 4.0% on the December quarter a year ago.
First Home Buyers continue to be between a rock and hard place. The number of loans approved for First Home Owners in the December quarter was 29,788, down -7.3% on December quarter 2023. The share of loans was 23.9% based on number of total loans approved and 19.5% based on $ value of all loans.
The reality is established home owners have the buying power as reflected in the average value of loans written in the December quarter.
2.10 $ Value per loan original

The average value of loans for Owner Occupiers and Investors is over $650,000 compared to First Home Buyers average loans for the December quarter which were $544,229.
Strange Times – Housing prices both up and down
Depending on the where you live median housing prices for the December quarter have seen a lot of variation.
2.11 Dwelling price growth

Dwelling prices for both houses and apartments have defied gravity in Brisbane, Adelaide and Perth with gains ranging from 11.4% (houses Brisbane) to 24.8% (apartments Perth). By comparison Melbourne was down -5.0% for houses and -4.0% for apartments.
The big unknown on prices remains the impact of rate cuts and lower inflation. Yes, this should make housing more affordable as mortgage repayments as a proportion of income improves slightly. However, only time will tell if these gains are simply eaten up by housing price rises.
")
")
")
")