
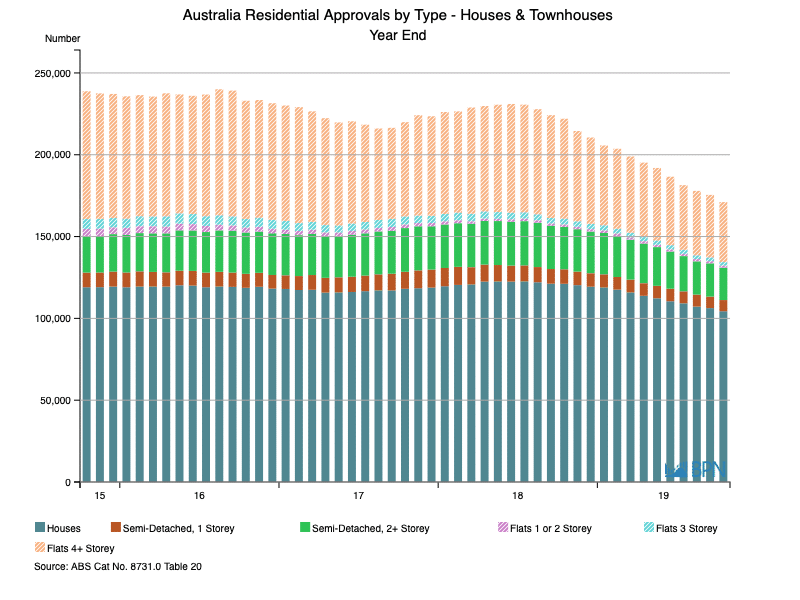
Annual approvals declined to 171,086 separate dwellings over the year-ended October 2019, some 22.9% lower than a year earlier. Feeding into that, the firmament of dwelling construction in Australia – free-standing houses – saw approvals decline a more modest 13.9% to 104,329 approvals.
October saw free-standing dwelling approvals flatten out at 8,796 separate approvals, amidst a group of signs – including those related to lending and finance addressed elsewhere in this edition of Stats Count – that the new dwelling market is bottoming out.
It could be that the bottom will come first for free-standing dwellings and that it is about to be reached at somewhere near 100,000 approvals on an annualised basis. The chart below gives the beginnings of the future of hint that has already commenced.

To go straight to the dashboard and take a closer look at the data, click here.
The free-standing house story was supported by Fletcher Building at its AGM in late November, where its CEO Ross Taylor reportedly commented the company expects dwelling approvals to bottom between 150,000 and 160,000 approvals some time in the current financial year, before turning up each of the next two years and returning above 215,000 approvals in 2021-22.
While the first chart shows the pain felt in the free-standing housing sector, the reality is that it is relatively stable, compared to the other formats.
As we see in the chart below, it is hard to escape the punishment metered out to multi-storey apartments, especially the 4+ Storey formats, over the last two years. If Fletcher’s Taylor is correct, the recovery in approvals will likely be more symmetrical than the decline.
To go straight to the dashboard and take a closer look at the data, click here.
The table below calculates the asymmetry in dwelling approvals over the last year. As we regularly comment, the Semi-Detached or Townhouse formats can be joined and observably, operate to different dynamics to the other multi-unit dwelling formats.
Likewise, we might reasonably join the 3 Storey Flats and the 4+ Storey formats, which are also experiencing similarities in their declines.
As ever, ignore the near irrelevant 1 and 1 Storey Flats.
| YE Oct ’18 | YE Oct ’19 | % Change | |
| Houses | 121,119 | 104,329 | -13.9 |
| Semi-Detached, 1 Storey | 8,872 | 6,839 | -22.9 |
| Semi-Detached, 2 Storey | 25,898 | 19,786 | -23.6 |
| Flats 1 or 2 Storey | 1,547 | 1,344 | -13.1 |
| Flats 3 Storey | 3,470 | 2,097 | -39.6 |
| Flats 4 + Storey | 61,112 | 36,691 | -40.0 |
| Total Dwelling Units | 222,018 | 171,086 | -22.9 |
Turning to state level approvals, we can observe in the chart and table below that the main states have experienced relatively consistent approval declines over the last year. New South Wales, Victoria and Queensland have each experienced approval declines of around one quarter, over just a year. The ACT was similarly infected, but the other states were not.

To go straight to the dashboard and take a closer look at the data, click here.
| YE Oct ’18 | YE Oct ’19 | % Change | |
| NSW | 67,414 | 50,781 | -24.7 |
| VIC | 74,422 | 55,925 | -24.9 |
| QLD | 41,915 | 30,520 | -27.2 |
| SA | 12,039 | 11,040 | -8.3 |
| WA | 16,971 | 15,172 | -10.6 |
| TAS | 2,978 | 3,229 | 8.4 |
| NT | 666 | 598 | -10.2 |
| ACT | 6,655 | 5,098 | -23.4 |
It is worth drilling into a state to see what has happened to it over the last year. Because it was alone in recording an approvals increase, Tasmania is an interesting case. Its approvals rose 8.4% over the year-ended October 2019, and are in aggregate, continuing to rise as the green line shows.

To go straight to the dashboard and take a closer look at the data, click here.
Of interest is that Tasmania’s approvals of free-standing dwellings appears to have plateaued (the red line and blue bars). Looking at the chart below, we can see that houses are utterly dominant in Tasmania, and in fact, are at near historic record proportions. That is no surprise in a state that has little need for high rise developments.
Over the year-ended October, free-standing dwellings accounted for a whopping 90.6% of total approvals. Remarkably, that was down from 90.9% a year earlier.

To go straight to the dashboard and take a closer look at the data, click here.
| YE Oct ’18 | YE Oct ’19 | % Change | |
| Houses | 2,690 | 2,876 | -6.9 |
| Semi-detached 1 storey | 130 | 126 | -3.1 |
| Semi-detached 2 or | 99 | 69 | -30.3 |
| Flats 1 or 2 storey | 24 | 10 | -58.3 |
| Flats 3 storey | – | 22 | – |
| Flats 4 + storey | 16 | 71 | 343.8 |
")

")
")
