

Critical freight cost measures are rising rapidly as the oil crisis in the Middle East drags on, compounding already unstable freight and logistics systems that have been dramatically affected by US-led trade upheavals. Unsurprisingly, freight costs are continuing to rise, with some supply yet to be fully impacted
Container freight costs ramping up
The China Containerised Freight Index (CCFI) shows the cost of shipping finished goods from China around the world. Since the February 28th outbreak of the war in Iran, the Composite Index of the CCFI – a trade weighted index using major regional routes as proxies – has increased 25.0%. That is equivalent to a doubling of container freight costs over a full year.
The journey from southern China to Australia and New Zealand (the route to Melbourne is the regional proxy) saw the local index up 23.2%, but as the chart shows, that occurred primarily in the second half of the period since the commencement of hostilities.
One possible explanation is that had the war been as short-lived as originally suggested, there would have been negligible impact on the southern trade routes and their access to fuel via Singapore. As the war continued and Singapore became embroiled, the Australia/NZ index has rapidly shifted to catch up with the global Composite Index.
The tyrannies of distance when distance is no longer a protection!
China Containerised Freight Index: 28 Feb ’26 – 22 May ‘26
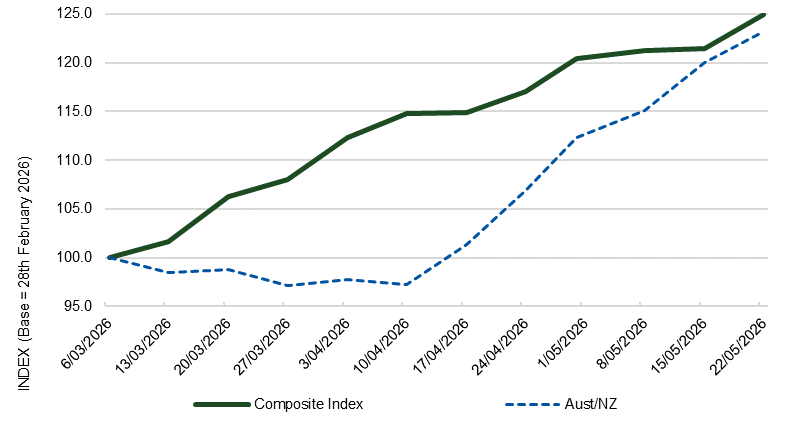

Source: Shanghai Shipping Exchange
Sawn softwood freight costs yet to feel effect
Australia’s sawn softwood import freight cost averaged AUD75.30/m3 in March 2026, up 10.2% on the prior month. However, this was a return to normal duty, with the March result linking into a continuing trend of declining freight costs.
The chart demonstrates the cost of freight for sawn softwood imports to Australia has largely returned to pre-pandemic levels in cash terms (the black line). Perhaps of more interest is that freight as a proportion of total landed cost continues to trend down, rising modestly in March 2026 to just 10.2% (the green bars).
It may be some months before additional freight costs for shipments ordered in March and April begin to be evident.
Australian Sawn Softwood Freight Cost Index: Jan ’17 – Mar ‘26 (INDEX & %)

Source: ABS and IndustryEdge
Dry bulk goods freight costs climb
The main bulk shipping index – the Baltic Dry Index (BDI) – was up 12.2% over the month to 22nd May 2026 and is 123% higher than just one year ago.
Though daily rates routinely change, bulk good shipping costs continue to shift rapidly higher, due to the current turmoil in the Middle East and the compounded effects of a lack of global maritime security and stability.
The chart shows the BDI lifted 39.8% from 27th February to 22nd May 2026. A sizeable increase being felt in all sectors, one not likely to decrease quickly and unfortunately, set to feed into secondary and tertiary manufactured goods for many months to come.
Baltic Dry Index (Bulk Dry Shipping): 27 Feb ’26 – 22 May ‘26
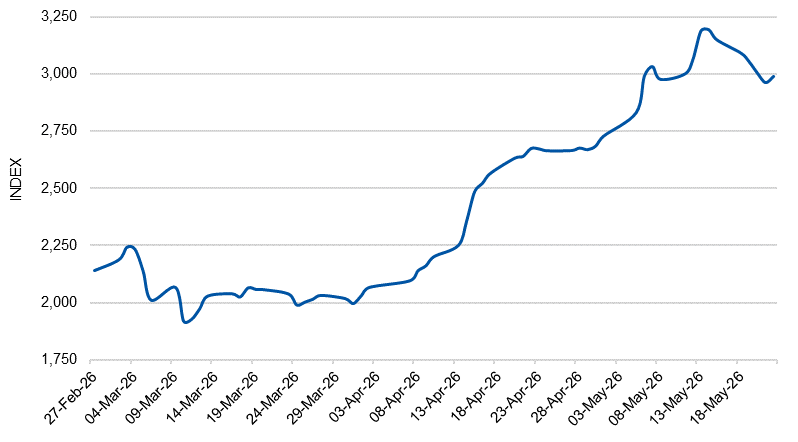
Source: Bloomberg and Trading Economics
")
")
")
")
