
In November 2021, dwelling approvals totalled 16,448 separate approvals, up 3.6% on the prior month. Houses accounted for 11,040 separate approvals, up 1.7% on October. Though still strong by any measure, monthly house approvals were 8.1% lower and total approvals were down 7.7% compared to the monthly equivalent in November 2020.
The first chart shows total approvals and demonstrates the one big truth of the latest building boom: its all been about houses!
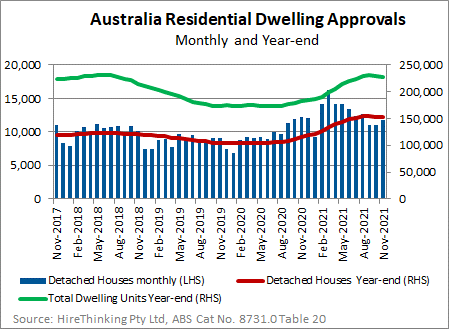
That is an easy assertion when we consider that over the year-ended November, approvals of houses totalled 152,260 dwellings, around two thirds of the total. That is evident in the following chart, showing the last three years of approvals data.

If the one big truth is that houses rule the housing market, the one big challenge is that there is so much work in the pipeline, much of it resides over normal supply chain horizons. In the Australian Financial Review Michael Bleby has discussed the Omicron isolation requirements as creating labour constraints for the sector, and there is already evidence of that.
The risks go deeper as the pipeline goes out further. Builders are concerned that for many, the boom will be without profit because their margins are being eaten up by higher materiel and wages costs. That is especially difficult with so much of the pipeline being committed to now and previously, but not to be built for six to twelve months.
Turning to the state level approvals, we can observe NSW has experienced a big bounce back with year-ending approvals for total dwellings reaching 62,697, up 25.6%. Still, as the chart below shows, Victoria continues to lead the nation, with year-ending total approvals of 70,587 up 10.3% on a year earlier.

In the case of NSW, the solid rise has come from increases in detached houses (up from 25,674 year-ended November 2020 to 31,747 year-ending November 2021), Semi-detached 2 story (up from 5,475 to 8,225) and Flats 9+ storeys (up from 6,967 to 9,743).
By comparison, Victoria has seen the major increases come from detached houses (up from 39,419 to 49,016). Houses were accompanied by gains in Flats 4 to 8 storey (up from 3,391 to 5,006) but contrast with a big reduction in Flats 9+ storeys (down from 9,655 to 2,822).
A moment on the third biggest market – Queensland – seems warranted. Year-ended November 2021, total approvals were up 41.0% to 44,359 separate approvals. Flats 9+ Storeys lifted 164% to 5,397, but the headline is again free-standing houses. Approvals of houses reached 30,264 for the year, up 36.9% on the prior year.

There is plenty of building work in the housing sector in the sunshine state, and in many respects, Queensland is the bellwether for the smaller states, as earlier charts show. One possibility is that new approvals will slow in the densely populated cities, but continue in the less populated cities and regions. Tree change, anyone?
")

")
")
")