
Date: 31 July 2023
Australia’s total imports of Engineered Wood Products (EWPs)* were valued at AUD331.2 million on a free-on-board (FOB) basis, year-ended May 2023. The result saw the value of annual imports down 2.8% compared to the prior month, consistent with the general experience for wood products and the broader building and construction industry.
Detailed volume data for LVL imports shows softwood grades accounting for 75% of total imports. Unfortunately, only LVL data can be analysed by volume, but the value data shown below for all EWP imports provides some useful information.
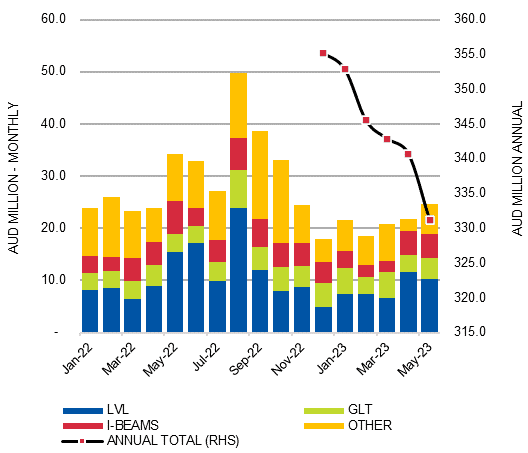
Australia’s EWP Imports by Main Type: Jan ’22 – May ’23 (AUD million)
Source: ABS and IndustryEdge
All the data used to assemble this report is available to download from IndustryEdge’s Wood Market Edge online data library.
The chart clearly demonstrates the peak import month was August 2022, when imports were valued at AUDFob49.7 million. Since August 2022, imports fell and have plateaued at around AUD20 million per month. In May, imports totalled AUD24.635 million.
Below, the table shows the experience of the last three months. It should be noted the ‘Other’ designation is widely expected to include some Laminated Veneer Lumber (LVL).
Monthly EWP Import Values: Mar ’23 – May ’23 (AUD)
|
AUDFob |
LVL |
GLT |
I-BEAMS |
OTHER |
TOTAL |
|
Mar ’23 |
6,606,745 |
5,027,469 |
2,048,608 |
7,058,872 |
20,741,693 |
|
Apr ’23 |
11,644,321 |
3,250,390 |
4,611,143 |
2,265,723 |
21,771,577 |
|
May ’23 |
10,213,925 |
4,103,143 |
4,611,144 |
5,706,824 |
24,635,036 |
|
% Change (Latest Month) |
-12.3% |
26.2% |
0.0% |
151.9% |
13.2% |
Source: ABS and IndustryEdge
* These measures are based on data analysis by IndustryEdge, of a data series that commenced January 2022. The relatively new status of the data impedes some analysis, but that will improve over time. It should be noted that some imports of EWPs may still be reported under previous import codes.
LVL (Laminated Veneer Lumber)
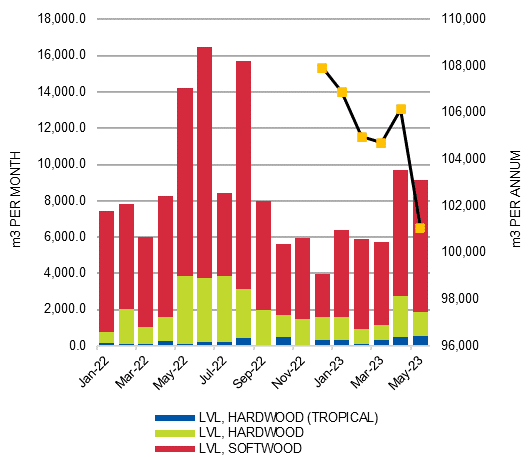
Over the year-ended May 2023, specifically declared imports of LVL totalled 101,037 m3. These specific imports are not all the LVL imported to Australia. As described above, much of the volume is expected to be included in the ‘Other’ designation for engineered wood product imports.
Specifically declared imports of LVL are the only engineered wood product for which volume or quantity details are available.
Australia’s LVL Imports by Grade: Jan ’22 – May ’23 (m3)
Source: ABS and IndustryEdge
|
m3 |
LVL, Hardwood (Tropical) |
LVL, Hardwood |
LVL, Softwood |
Total |
|
YE May ’23 |
3,583.3 |
22,250.8 |
75,202.6 |
101,036.7 |
|
Proportion (%) |
3.5% |
22.0% |
74.4% |
In May 2023, the weighted average price of LVL imports was AUDFob1,119/m3. As the chart shows, the hardwood LVL that includes tropical timbers is very varied in price, consistent with small and variable import volumes. By contrast, the larger volumes of softwood LVL are more consistently priced and as a result, drive the weighted average price.
Australia’s LVL Imports by Grade: Jan ’22 – May ’23 (AUDFob/m3)

Source: ABS and IndustryEdge
|
AUDFob/m3 |
LVL, Hardwood (Tropical) |
LVL, Hardwood |
LVL, Softwood |
Total |
|
May ’22 |
1,525.2 |
918.5 |
1,141.9 |
1,087.4 |
|
May ’23 |
931.2 |
1,111.3 |
1,134.8 |
1,119.2 |
|
% Change |
-38.9% |
21.0% |
-0.6% |
2.9% |
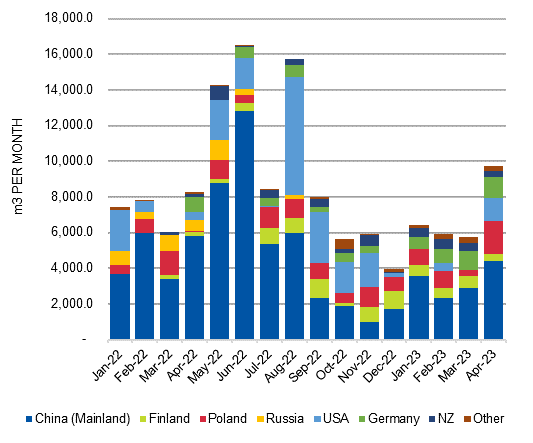
China was the main supplier over the year, contributing just less than half of total declared LVL imports.
Australia’s LVL Imports by Country: Jan ’22 – May ’23 (m3)
Source: ABS and IndustryEdge
|
m3 |
China (Mainland) |
Finland |
Poland |
USA |
Germany |
NZ |
Other |
|
YE May ’23 |
47,959.0 |
8,977.9 |
10,815.6 |
18,477.4 |
7,481.9 |
4,795.7 |
2,486.5 |
|
Proportion (%) |
47.5% |
8.9% |
10.7% |
18.3% |
7.4% |
4.7% |
2.5% |
GLT (Glue Laminated Timber)
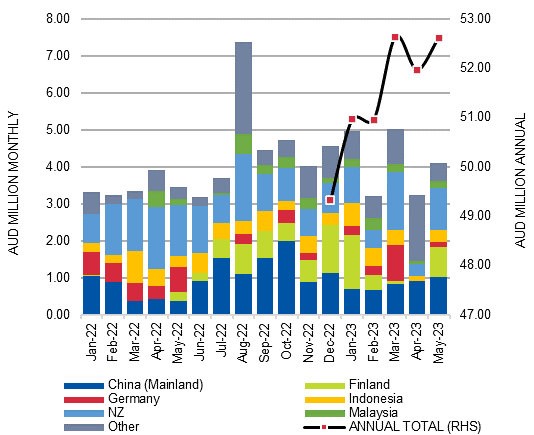
Imports of GLT were valued at AUD52.6 million year-ended May 2023, 1.2% lower than for the year-ended April. Monthly imports were valued at AUD4.1 million in May.
As the chart and table demonstrate, New Zealand (22.3%) and China (25.4%) dominated import supply across the year. Unfortunately, the data does not provide further details – of volumes, quantities or species for instance – but the data will add to understanding the total size and value of the Australian market.
Australia’s GLT Imports by Country: Jan ’22 – May ’23 (AUD million)
Source: ABS and IndustryEdge
|
AUD Million |
China (Mainland) |
Finland |
Germany |
Indonesia |
NZ |
Malaysia |
Other |
ANNUAL TOTAL |
|
YE May ’23 |
13.4 |
7.4 |
2.4 |
4.9 |
11.7 |
2.6 |
10.3 |
52.6 |
|
Proportion (%) |
25.4% |
14.0% |
4.5% |
9.3% |
22.3% |
4.9% |
19.6% |
I-BEAMS
Imports of I-Beams were valued at AUD48.6 million year-ended May 2023. Monthly imports in May were declined to be valued at AUD3.807 million.
As the chart and table demonstrate, Poland (40.1%) and Sweden (32.4%) dominated import supply over the year.
Australia’s I-Beam Imports by Country: Jan ’22 – Apr ’23 (AUD million)
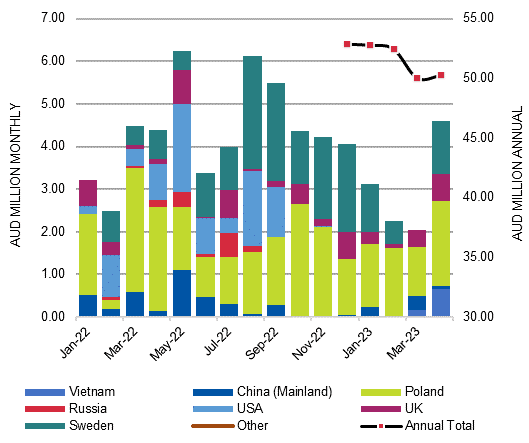
Source: ABS and IndustryEdge
|
AUD Million |
Vietnam |
China (Mainland) |
Poland |
Russia |
USA |
UK |
Sweden |
Other |
TOTAL |
|
YE May ’23 |
1.44 |
2.12 |
19.20 |
0.77 |
4.12 |
4.36 |
15.49 |
0.32 |
47.83 |
|
Proportion (%) |
3.0% |
4.4% |
40.1% |
1.6% |
8.6% |
9.1% |
32.4% |
0.7% |
|
CLT (Cross Laminated Timber)
Imports of CLT were valued at AUDFob1.438 million year-ended May, down almost 63% on the year-ended April, as a larger import supply dropped from the annual series. Over the year, supplies from Austria accounted for 80.5% of the total value.
")

")
")
