

The latest data on engineered wood product (EWP) imports for the year ending April 2025 shows mixed trends across product categories.
Key highlights include:
- Annualised EWP imports were valued at AUD311.2 million, year-ended April 2025, up 2.1% compared to the prior month
- Declared LVL imports totalled 150,548 m3 over the year (but will have been higher due to some LVL imports being classified as ‘Other EWPs’)
- Particleboard imports down 41% over the year
- Plywood imports up 4.5% over the year
- MDF imports down 13.6% over the year
- OSB imports down 20.2% year-ended April 2025
Engineered Wood Products
Imports up 2.1% on an annualised basis
Australia’s total imports of Engineered Wood Products (EWPs)* were valued at AUD311.2 million on a free-on-board (FOB) basis, year-ended April 2025. The result saw the value of annual imports rise 2.1%. The trade summary of EWP products is below.
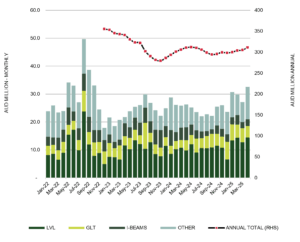
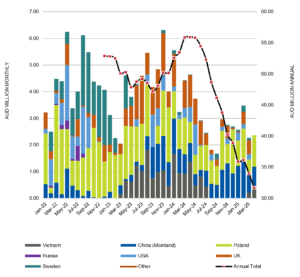
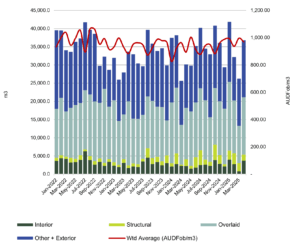
Australia’s EWP Imports by Main Type: Jan ’22 – Apr ‘25 (AUD million)
Source: ABS and IndustryEdge
The chart shows the peak import month was August 2022, when imports (Free-on-board or Fob) were valued at AUDFob49.7 million. After August 2022, imports fell sharply but stabilised in the range of AUDFob20-30 million per month, at least on a value basis. In April, consistent with an emerging growth trend, the value of imports totalled AUD32.6 million, up 20.3% compared to the last month.
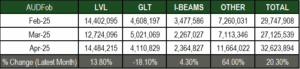
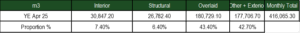
Below, the table shows the experience of the last three months. It should be noted the ‘Other’ designation for EWP imports is widely expected to include some Laminated Veneer Lumber (LVL).
Monthly EWP Import Values: Feb ’25 – Apr ’25 (AUD)
Source: ABS and IndustryEdge
* These measures are based on data analysis by IndustryEdge, of a data series that commenced January 2022. The relatively new status of the data impedes some analysis, but that will improve over time. It should be noted that some imports of EWPs may still be reported under previous import codes.
LVL (Laminated Veneer Lumber)
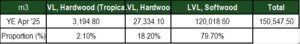
Over the year-ended April 2025, specifically declared imports of LVL totalled 150,548 m3.
These specific imports are not all the LVL imported to Australia. As described above, some of the volume is expected to be included in the ‘Other’ designation for engineered wood product imports. This is mainly because only LVL meeting the exact definitions of the specific Softwood, Hardwood and Tropical wood LVL can be included under those designations.
It is important to underscore that this is not a measure to avoid market transparency.
Specifically declared imports of LVL are the only engineered wood product for which volume or quantity details are available.
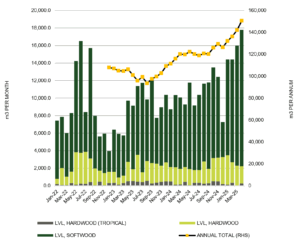
Australia’s LVL Imports by Grade: Jan ’22 – Apr ’25 (m3)
Source: ABS and IndustryEdge
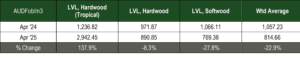
In April 2025, the weighted average price of LVL imports was AUDFob814.66/m3. As the chart shows, the hardwood LVL that includes tropical veneers is very varied in price, consistent with small and equally variable import volumes. By contrast, the larger volumes of Softwood LVL are more consistently priced and as a result, drive the weighted average price.
Australia’s LVL Imports by Grade: Jan ’22 – Apr ’25 (AUDFob/m3)

Source: ABS and IndustryEdge
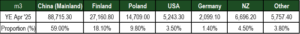
China was the main supplier over the year, contributing more than half of total declared LVL imports. Subscribers can interrogate this data further, which shows country and port level trade for each LVL grade.
Australia’s LVL Imports by Country: Jan ’22 – Apr ‘25 (m3)
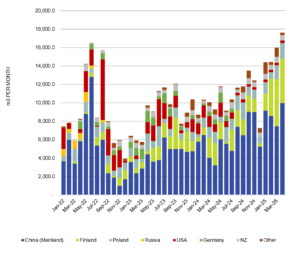
Source: ABS and IndustryEdge
GLT (Glue Laminated Timber)
Imports of GLT were valued at AUD55.2 million year-ended April 2025, up 0.8% on the previous month. Monthly imports were valued at AUD4.01 million in March, down 18.1% than the previous month’s AUD5.0 million.
As the chart and table demonstrate, New Zealand (40.5%), China (16.7%), and Indonesia (16.4%) dominated import supply across the year. Unfortunately, the data does not provide further details – of volumes, quantities or species for instance – but the data does add to understanding of the total size and value of the Australian market.
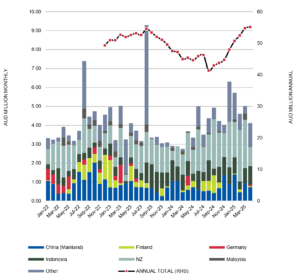
Source: ABS and IndustryEdge

Source: ABS and IndustryEdge
I-Beams
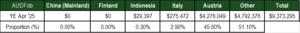
Imports of I-Beams continue to slide valued at AUD31.7 million year-ended April 2025. Monthly imports totalled AUD2.4 million. As the chart and table demonstrate, Poland (37.7%), China (30.5%), UK (14.2%), and Vietnam (7.4%) dominated import supply over the year.
Source: ABS and IndustryEdge

CLT (Cross Laminated Timber)
Imports of CLT were valued at AUDFob9.4 million, up 11.2% over the year-ended April. Over the year, supplies from Austria accounted for 45.6% of the total value while new entrant Netherlands accounted for majority of the total value and is included in the “Others” tab.
Wood Panels
Particleboard
Annual imports fell 40.9% year-ended April 2025
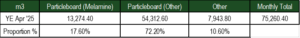
Australia’s annual particleboard imports fell 40.9% across the year-ended April 2025, to total 75,260 m3. Over the same period, import prices averaged AUDFob476/m3.
The major import grade is ‘Particleboard (Other)’, that is, raw Particleboard without a melamine finish.
Imports of this grade totalled 54,313 m3 across the year, down 41.3% from the previous year, accounting for 72.2% of all Particleboard imports. In April, the average import price for the Particleboard (Other) grade increased to AUDFob595/m3.
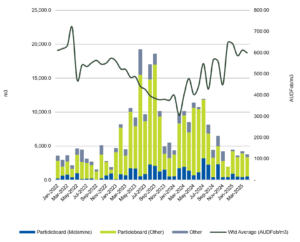
Source: ABS and IndustryEdge
The table below shows the annual import volume for Particleboard imports for the year-ended March 2025.
Plywood
Annual Imports up 4.5% year-ended April 2025
Plywood imports rise 4.5% to total 416,065 m3 year-ended April 2025. These imports do not include plywood-backed material like that used for flooring, wafer, batten, and other board products that are mingled into traditional plywood definitions.
The chart below displays the import experience.
Australian Plywood Imports: Jan ’22 – Apr ’25 (m3 & AUDFob/m3)
Source: ABS and IndustryEdge
The table below shows annual Plywood imports for the year-ended April 2025.
Source: ABS and IndustryEdge
Medium Density Fibreboard (MDF)
Imports fell 13.6% year-ended April 2025
Australia’s imports of Medium Density Fibreboard (MDF) were 13.6% lower year-ended April 2025, compared to the previous year. Imports totalled 118,693 m3 for the year.
Of the different density grades, imports of the ‘Other-Other’ grade continue to record significantly higher volumes. This grade saw imports total 58,719 m3 across the year, down 13.4% on the previous year.

Oriented Strand Board (OSB)
Imports down 20.2% year-ended April 2025
Imports of Oriented Strand Board (OSB) totalled 25,904 m3 year-ended April 2025, down 20.2% compared to the prior year. Monthly import volumes had generally been stable from early 2021, with volumes averaging approximately 3,000 m3 per month in total. In April 2022, imports temporarily spiked, averaging approximately 6,000 m3 per month.
From September 2022 shipments returned to more typical levels but have again become more varied each month. From April 2023 onwards, OSB shipments again began to average 3,000 m3 per month.
In April 2025 shipments got back to its normal range to a total of 3,864 m3, up significant 536% on the month prior.
Prices stabilised during early 2021, after which they became erratic, before entering a near year-long period of decline. In April 2025, the weighted average price was AUDFob382.75/m3 or a decrease of 35.2% compared to the month prior
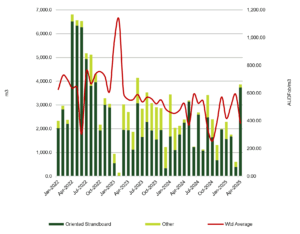
Source: ABS and IndustryEdge
")


