
After rising to near decade-long highs in late 2017, loans to first home buyers slipped back to 10.6% of total loan value in February 2018. Although still valued at approximately AUD2.878 billion in February was consistent with prior months, but still pales compared with the AUD12.030 billion of loans issues to investors in the month. Investor loans accounted for 44.5% of the total value of loans for the month, moderately higher than the middle of 2017, but well below the peak of 49.5% reached in January 2017.
Softening in the value of loans issued to investors and first home-buyers means, in the current climate, that the total value of loans has slipped, or that the role of owner-occupiers has increased. In this case, in aggregate, the role of owner-occupiers has increased, but their housing loan experience is also a little variable at the moment.
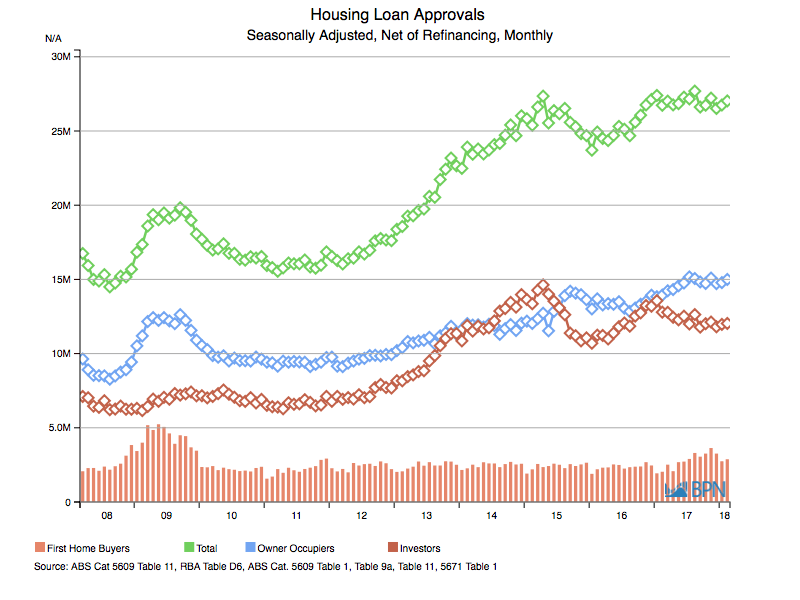
The chart below shows the total value of loans – AUD27.026 billion in February 2018 – along with the role of each of these different borrowing groups.
To go straight to the dashboard and take a closer look at the data, click here.
We can see the fall in investor loan values (the red line), and the seemingly short-lived lift in first home-buyer loans (the red bars), and importantly, the role of owner-occupiers is also evident (the blue line). At 55.5% of total loan value in February 2018, the AUD14.996 billion in loans to owner-occupiers is only a little short of the monthly record set in July of 2017.
It is never easy to identify why first home-buyer shares of the value of loans are not growing. Could it be, for example, that their share of value is stable, but they are buying into cheaper housing stock where prices are not growing as strongly as in the areas where established borrowers are transacting and building new dwellings? If so, perhaps first home-buyers are getting a higher share of the number of loans, albeit without the value share keeping up.
Given that at some point in 2017, according to commentators like BIS Oxford Economics, Australia shifted from a position of long-term housing under-supply to short-term theoretical over-supply, we could also be experiencing a period of renewed stability in the housing market, which could influence the behavior of borrowers, as much as speculators and lenders.
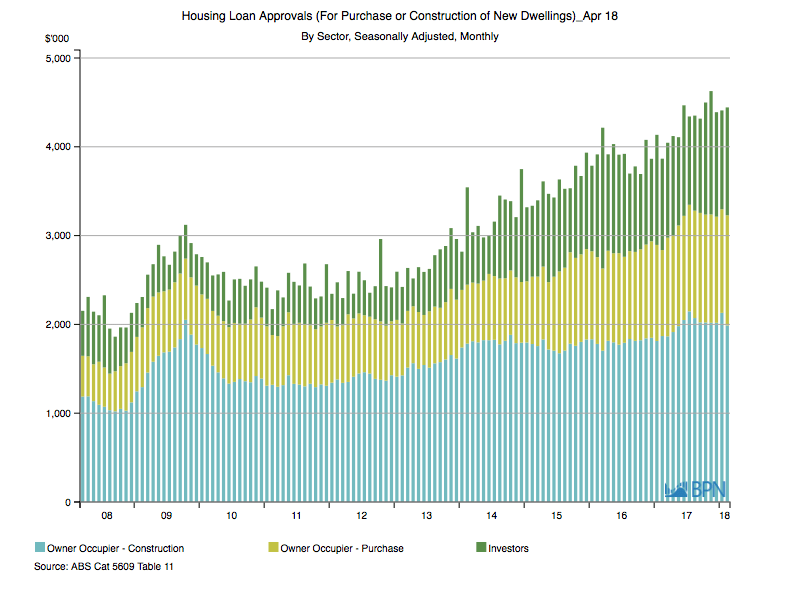
The components of household lending – as opposed to exactly who is doing the borrowing – may provide some insights. The chart below shows the value of loans from a different perspective.
To go straight to the dashboard and take a closer look at the data, click here.
The blue bar at the bottom shows that the value of loans to owner-occupiers to construct new dwellings has been stable over the last year – quite consistent in fact with dwelling approvals data over a longer period. However, on an annualized basis, for the year-ended February, loans for this purpose totalled AUD24.225 billion, up 11.5% on the prior year.
The situation has been the same for loans to owner-occupiers to fund new purchases, shown in the light green bar. Rising to AUD14.179 billion for the same period, they are up a very strong 16.7% on the prior year.
")

")
")
