
Given the challenging economic times, it is perplexing – negatively counterintuitive we might say – to see house prices continuing their upward trajectory. Classic economics seem to be at play here, with limited supply (both established and new builds) delivering greater demand for established dwellings, forcing prices up.
The main indicator is that the median residential price was up 2.1% in the September quarter, and 3.9% compared with a year earlier.
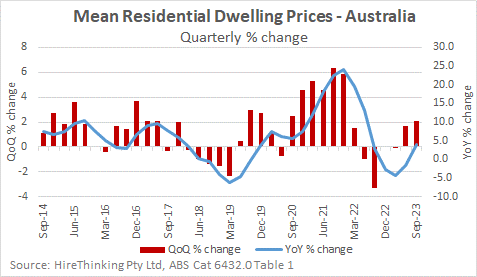
Significantly, over the year-ended September, dwelling price increases were apparent in all markets except Melbourne (houses down 3.5%, Apartments down 1.9%) and Hobart (houses down 4.9%, Apartments down 3.4%) and Canberra (houses down 3.5%).

Normally, firming house prices would be good for the new housing market because new builds can be a more competitive option, as established home prices increase. However, the reality is a little different right now. Prospective buyers need to be able to raise the finance needed – mainly that’s a 20% deposit now. With the recent increase in interest rates, that has become yet more difficult again.
Latest data from the CoreLogic Housing Affordability report indicates the average time it takes to assemble a 20% deposit has lifted to 10.0 years, down from 10.2 years a year earlier, but well above the decadal average of 9.2 years.
In the September quarter, the proportion of income required to service a new mortgage rose to 46.2%, up from 40.3% just a year earlier. For those renting, the proportion of income required to cover rent lifted to a record 31.0% in the September quarter.
That is a massive reduction in general economic capacity. The dampening effect of price increases is evident, just as it is for the general inflation that the interest rate rises are supposed to suppress.
A macro measure of affordability is the proportion of household income needed to pay the interest on a standard home loan.
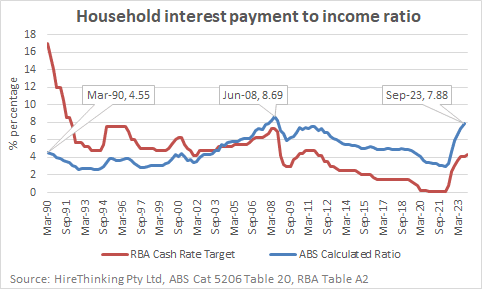
The September quarter ratio of 7.88% is based on an official cash rate of 4.1% (the red line) as the November interest rate rise is yet to be taken up in the housing price data. This compares to the peak of 8.69% in June quarter 2008 when the official cash rate was 7.25%.
In the interest rate cycle prior to that, the Cash Rate peaked at 17.0% in March 1990 with the interest to income ratio a paltry 4.55%. This reflects the increased level of housing debt, with the ratio of housing interest payments to household income now higher than when the official cash rate peaked in the “recession we had to have”.
In that context, the case for further interest rate increases, may be seen as poor from at least the end of September.
")

")
")
")