Dwelling approvals in June were 17,076 up 11.9% for the month. On a less volatile year-ending basis total dwelling approvals in June were 184,834 up 13.5% on the 162,873 approvals in the previous period. Given the lag in the data this does not reflect the decision by the RBA to further ease the cash rate by 25 basis points to 3.60% following the meeting on 12 August.
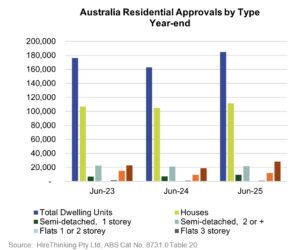
The year-end changes in all sectors was positive with detached house approvals up 6.1% to 111,370 compared to the previous period. Significantly multi-res approvals were very strong with Flats 4-8 storey up 27.7% to 11,812 and Flat 9+ storey up 51.6% to 28,467.
Approvals by state were all positive except for Tasmania.
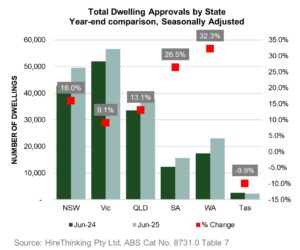

Source: ABS Cat 8731 Table 7
Reinforcing the improved outlook, Tarun Gupta, CEO, Stockland in announcing FY25 results commented “Affordability is improving. After the first rate cut in February, we saw a little bit of enquiry pick up. With the second cut in May the other states started to go, and Victoria started to move. Since the third cut in last week, July to June enquiries are up about 50%”.
RBA continues to lower interest rates
A further cut in the cash rate by 25 basis points to 3.60% at the August board meeting should provide further momentum for Housing Approvals in coming months. The improved results for June Housing Approvals covers the 25 basis points reduction announced following the 19 February meeting and some of the benefit from the 25 basis points reduction following the 21 May meeting. So still more impact from rates to flow through.
The positive effect on dwelling investment can be seen in the March 2025 quarter National Accounts data with improved growth experienced over the past 5 quarters.
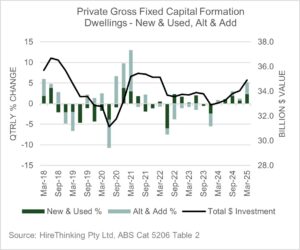

Source: ABS Cat 5206 Table 2
While the trend for inflation now appears well within the target band the RBA remains cautious about the outlook given global uncertainty and the potential impact on the Australian economy. Commenting in the Media Release associated with the 12 August announcement that “Trade policy developments are nevertheless still expected to have an adverse effect on global economic activity, and there remains a risk that households and firms delay expenditure pending still greater clarity on the outlook. As in May, the forecasts assume that both effects weigh on activity and inflation in Australia for a period.”
Building Activity – follows approvals with commencements up
The Building Activity report for the March quarter provides a more definitive view of the housing market. New Houses commenced in the quarter were 28,349 up 6.2% on the previous quarter. However, this was slightly more than completions which were 28,063 down -1.2% on the previous quarter. It’s the relationship between commencements and completions which impacts the number of houses under construction which were 86,341 during the quarter an increase of 1.6%.
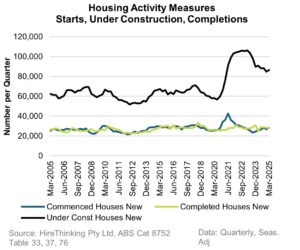

Source: ABS Cat 8752
Historically the level of houses under construction has been around 60,000 so the current level at 86,000 houses shows there is still more work to do to get on top of the backlog. The significance as discussed in other issues of Statistics Count relates to the capacity of the industry. If commencements run at a level beyond capacity, then all that happens is it takes longer to complete the same number of houses.
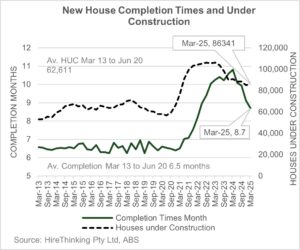
New house completion times have continued to improve and in March were down to 8.7 months. Still above the average of 6.5 months but well down on the peak of 10.41 months in June 2023.
Lending Activity on the up
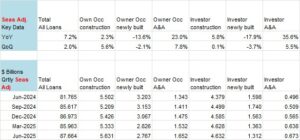
Reflecting the continuing increase in housing approvals lending activity in the June quarter was up 2.0% on the previous quarter and 7.2% compared to the June quarter 2024.
This trend is expected to continue with Dr Mish Tan, ABS Head of Finance and Statistics, commenting “lending activity is still at relatively high levels. While there were rate cuts in February and May, we will not see the full impact of these on new home lending activity until later in the year”.
However, its important to note that the headline number is dominated by loans for the purchase of existing dwellings. In the June quarter total loans were $87.66 billion with loans for the purchase of existing dwellings representing 83.8%.
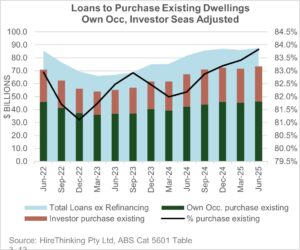
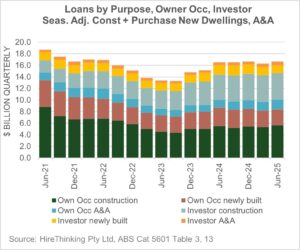
However, if we drill down into the loans of more significance to the timber industry the picture is still positive but more nuanced.
Source: ABS Cat 5601
Loans for the construction of new dwellings were up 5.6% for Owner Occupiers and a more modest 0.1% for Investors. On a relative basis loans for Alterations and Additions has experienced stellar growth increasing in the June quarter 7.8% for Owner Occupiers and 5.5% for Investors.
Whilst affordability is improving following RBA rate reductions First Homies are still getting it in the neck. In June quarter loans to First Home Buyers were up 5.2% while the share of total loans by $ value was 19.6% well down on the peak of 27.6% in December 2020.
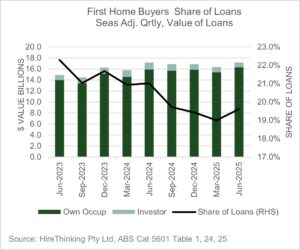
The reason the value of loans was up but the share is down is the average $ value per loan for First Home Buyers grew by 3.3% from $546,057 in March Quarter to $565, 057 in the June quarter.
House prices moderating?
The quarterly house price data series provides further insight into the impact of interest rate reductions and the associated expansion of home loan lending.
The ABS series for March shows median prices in capital cities were up in Brisbane, Adelaide and Perth. While house prices in Melbourne, Hobart and Canberra all declined over the year.
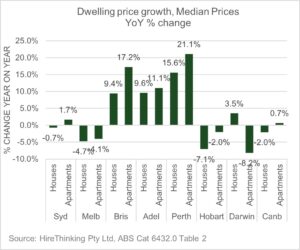

Source: ABS Cat 6432 Table 2
More recent analysis from Cotality for July shows price growth nationally over the past 12 months of 3.7% with a more moderate monthly increase in July of 0.6%.
The challenge in the months ahead will be for supply of housing to continue to improve thereby enabling the RBA’s interest rate cuts to flow through to improved affordability rather than increased housing prices. Time will tell.


