Australia’s dwelling approvals totaled 228,671 dwellings for the year-ended December 2015. Although slipping 0.8% from their all time peak of 230,475 separate approvals for the year-ended October 2015, the continuation of annual approvals at or above 200,000 dwellings is worthy of remark.
As the chart below shows, residential dwelling approvals have been in boom territory for the better part of the last three years. While they appear to be coming off their highs, it is clear that free-standing house approvals are remaining stable.

To go straight to the dashboard and take a closer look at the data, click here.
The data shows that for the year-ended December 2015, detached house approvals totaled 115,857 or 50.7% of total approvals. That proportion has been lower over 2015, but remarkably, annual approvals were at a low of 114,086 in January 2015 and peaked at 116,073 in September 2015. Smoothing out seasonality, the message is that detached or free-standing dwellings remain resilient because they are the preferred – and the dominant – form of housing approval.
Much of the discussion is centered on the rise of 4 or more storey apartment approvals and it is a topic covered often in Statistics Count. On this occasion, we will simply say that for the year-ended December 2015, 4 or more storey apartment approvals rose 41.8% on the prior year, to reach 72,352 approvals. This is the cause of the peaks in 2015 and it seems, when compared with the stability of free-standing house approvals, that the easing in approvals on a month on month basis is reflective of reductions in multi residential apartments.
In many respects, this duality in the housing market in Australia is likely to herald the end of the boom and bust cycle of housing development. A baseline of pent up demand exists in free-standing dwellings and activity to meet that demand is likely to continue long after any speculation bust is wrought upon the apartment market.
This is why there is considerable attention on the role investors play in the housing market.
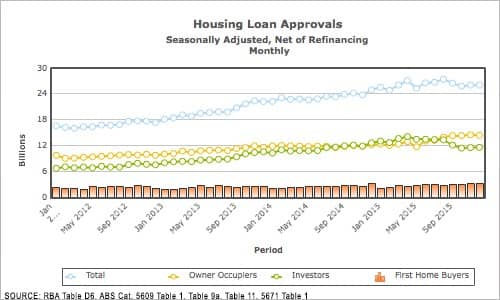
Under sustained pressure from regulators in early 2015, major banks began restricting investor access to loans, which in some months had exceeded 50% of the total value of all housing loans. As the chart below shows, this took some time to take effect, but by mid-2015, investors were under greater pressure as they sought new loans.
By year’s end, total monthly loan values had declined from their August 2015 record of AUD27.373 billion to be AUD26.079 billion in December 2015, largely as a result of declining investor loans, which fell to 44.6% of total loan values.

To go straight to the dashboard and take a closer look at the data, click here.
As investors struggled, owner-occupiers increased their proportion of loan values, as did First Home Buyers, whose share of total loans in December 2015 rose to 12.5% of the total and hit a new peak value of AUD3.257 billion.
Regulators and first home buyers will have spent the holiday period rejoicing, while investors headed off to find somewhere else to put their money.


