
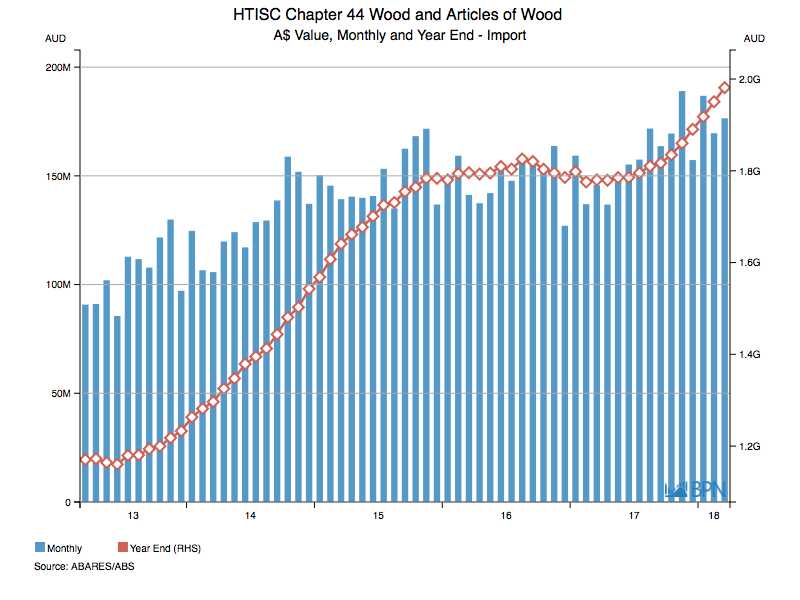
Imports of wood and wood products to Australia were valued at a record AUD1.981 billion for the year-ended March 2018, having risen 11.3% compared with the prior year. After a short dip in mid 2017, the value of imports has continued to rise, with little prospect of a decline, any time soon.
The chart below demonstrates the magnitude of the rise in imports over the last five years. From AUD1.170 billion for the year-ended March 2013, five years later, imports are valued at close to AUD2 billion.
To go straight to the dashboard and take a closer look at the data, click here.
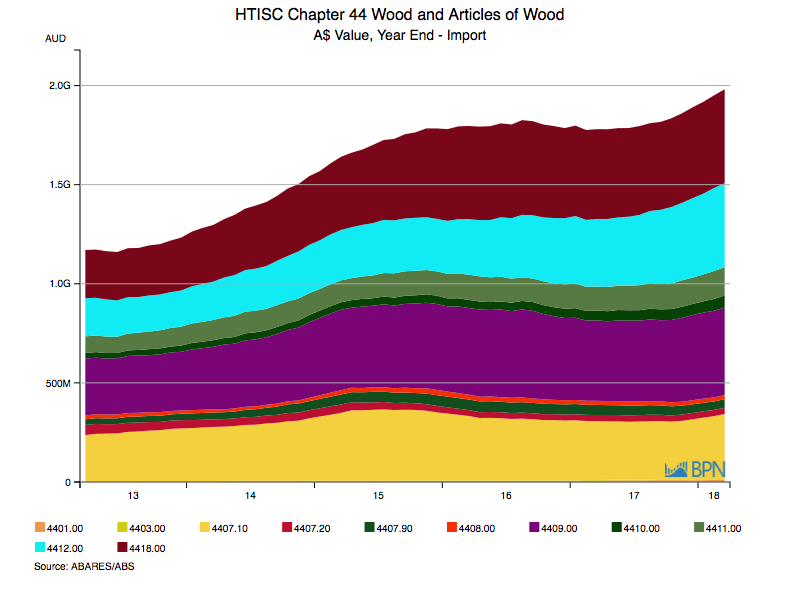
Although the value of imports is up in total, different grades have had different growth experiences over the five years.
To go straight to the dashboard and take a closer look at the data, click here.
While the chart tells a story, the table below provides the details for each of the grades. Over the course of the year to the end of March, only two major product groupings saw a decline in the value of their imports: Roundwood (logs) and Hardwood Sawnwood. All other grades experienced growth over the last year.
Over the longer term of five years, just one grade, Tropical Sawnwood, experienced a decline in the value of imports.
| Grade | Import Value YE Mar ’18 (AUDM) | 1 Year % Change | 5 Year Ave. % Change |
| Woodchips and pellets (4401) | 9.9 | 54.5 | 18.9 |
| Roundwood (4403) | 1.7 | -57.6 | 13.9 |
| Coniferous Sawnwood (4407.1) | 331.2 | 11.7 | 7.4 |
| Tropical Sawnwood (4407.2) | 31.4 | 1.5 | -9.3 |
| Hardwood Sawnwood (4407.9) | 43.5 | -14.8 | 9.2 |
| Veneer (4408) | 20.9 | 1.6 | 1.4 |
| Mouldings (4409) | 441.2 | 8.7 | 8.9 |
| Particleboard (4410) | 60.5 | 22.1 | 16.7 |
| MDF (4411) | 143.1 | 18.5 | 11.3 |
| Plywood (4412) | 423.5 | 24.1 | 17.1 |
| Builders’ Joinery (4418) | 474.1 | 4.7 | 14.3 |
Source: IndustryEdge
We can note that the value of imports of Coniferous Sawnwood grew solidly over the course of the last year. This has caused considerable comment in industry, but examination shows that there are other grades and products for which the value of imports rose more, and from a larger base.
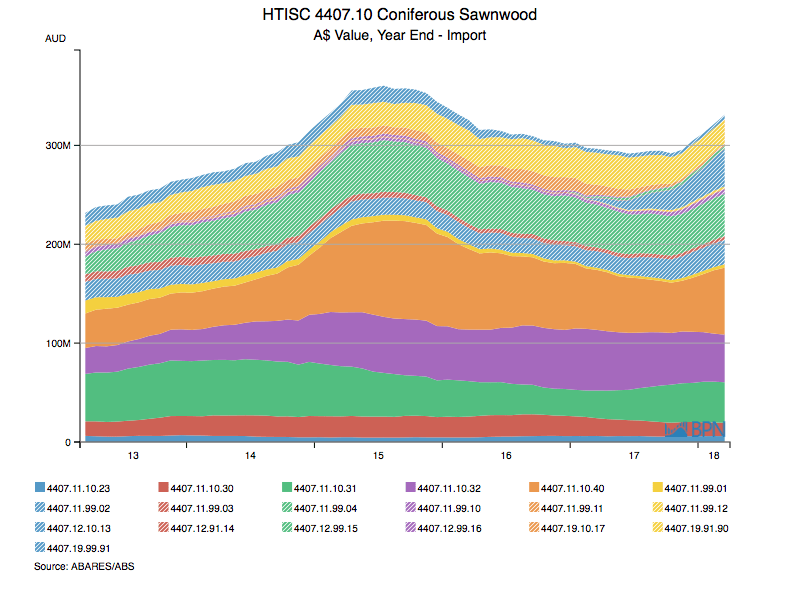
For the sake of completeness, it is worthwhile examining the sometimes contentious imports of Coniferous Sawnwood in more detail. The chart below shows the value of those imports by sub-grade.
To go straight to the dashboard and take a closer look at the data, click here.
It can be seen that the value of imports has risen over the last few months, but remains below the peaks reached in 2015.
The major sawn softwood import grades are set out in the table below, showing the value of imports for the year-ended March 2018, along with their rates of growth over one and five years.
| Grade | Import Value YE Mar ’18 (AUDM) | 1 Year % Change | 5 Year Ave. % Change |
| Dressed, treated, Radiata (4407.11.10.31) | 41.0 | 46.4 | -3.1 |
| Dressed, untreated, Radiata (4407.11.10.32) | 48.2 | -21.4 | 12.9 |
| Dressed, untreated, not Radiata (4407.11.10.40) | 67.7 | 11.7 | 14.2 |
| Dressed, untreated, not Radiata <120mm (4407.11.99.04) | 42.8 | -0.9 | 18.7 |
| Dressed, fir or spruce (4407.12.10.13) | 37.6 | NA* | NA* |
Source: ABS
* Code commenced operation 1 January 2017
It is important to note that these grades of sawn softwood are merely the largest by import value. They are not the only grades for which there has been growth. These are all associated with framing and structural applications and are thus linked almost entirely to dwelling approvals and new building activity.
The same driver applies for most of the other import products, which of course has everyone scrambling to understand why the value (and the volume) of some imports has grown more than others.
")

")
")
