For the year to end April 2015, total residential dwelling approvals hit yet another record, with 211,962 approvals. Monthly approvals have been higher on many occasions, including the legendary boom of 1973. However, such a sustained period of growth has never been experienced before, as pent up demand is supported by low interest rates.
The chart below shows Australian approvals since 1956. Cycles are clear in the long-run chart, but so also is the long period when new housing approvals exhibited very little growth, before the long decline that commenced in 2004.

For further details, go to the FWPA Data Dashboard.
Also evident in the long-run chart is the widening gap from free-standing houses (the red line), as a proportion of the annualised total (the green line). To put this in numbers, in May 1956, free-standing houses were 95.4% of all housing approvals. In April 2015, that proportion had declined to 55.1%. What a difference 59 years makes!
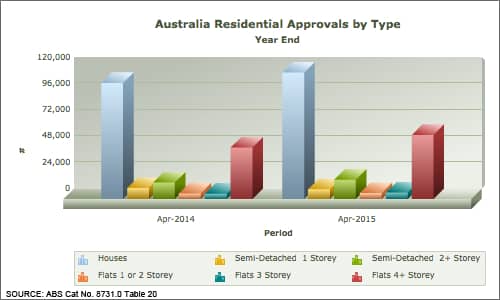
It is important to unpick this data further. Even a decade ago, by May 2005, free-standing houses were accounting for just 65.2% of total approvals. With multi-storey apartments dominating the 44.9% of dwellings that are not houses, it is clear that the role of wood and wood products in housing is changing at the same time. The growing importance of the four or more storey apartment block is evident in the following table.

For further details, go to the FWPA Data Dashboard.
As can be observed, free-standing houses still dominate the total, but the rising red bar is the four or more storey apartment block. Over the period for the year to April 2014, free-standing houses accounted for 56.4% of the total. A year later, for the year to the end of April 2015, that proportion had fallen to 55.1%.
The appetite for new housing is increasingly being met by multi-storey developments. That may be flowing through to softwood utilisation, which is detailed in the sales data described below.


