
For much of the last year, annualised sales of domestically produced sawn softwood have hovered around the 3.0 to 3.1 million m3 mark. Year-ended July, sales were at an annualised 3.048 million m3, up just 1.2% on the prior year, prompting the question whether Australia has reached its capacity and is at ‘peak softwood’?
In the current super-heated and heightened market, it would come as no surprise if the domestic sales, and by extension domestic production, were at their limits. Demand has been nothing but sensational and sustained, and import supplies are constrained. If local producers had any more to supply, it would be in the market.
We can see the extent to which the market appears capacity bound in the chart below. Try as it might, there just is not the production room – and more often, than not, the log supply either – to push much higher.
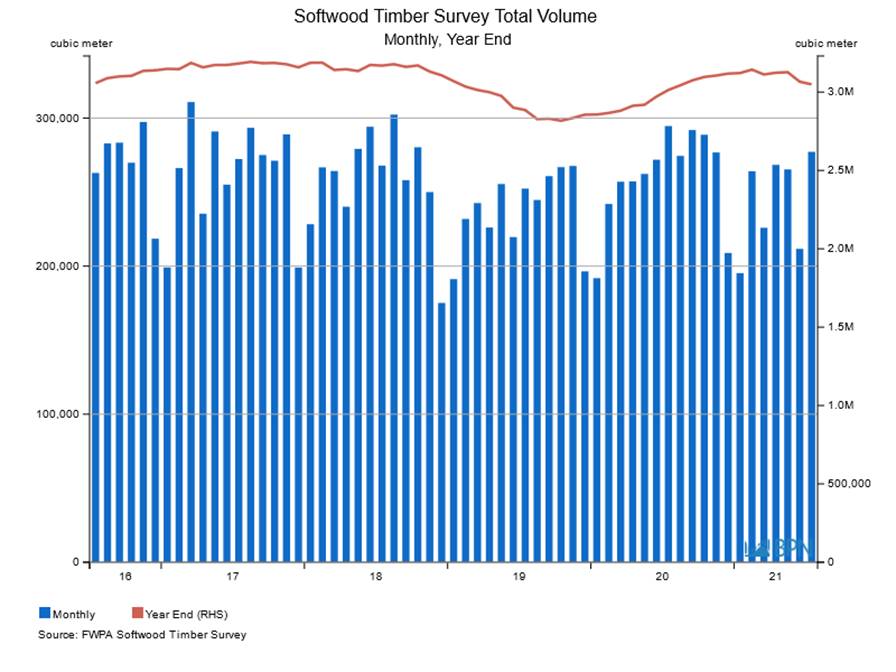
One indication of market stress is when despite a clear market trend, sales or trade is all over the place, month-on-month. We can see that in the last few months of total sales, where despite strong demand, monthly sales have moved around fairly sharply.
In July, sales totalled 277,235 m3, up around 31% on the prior month and at their highest level since November 2020.
While it may be battling for some time to come as it fights to supply every possible stick of wood into a rampant housing market with a huge pipeline, there is little doubt that sawnwood production – well sales anyway – are in a period of genuine evolution.
The reasons are not entirely clear, but as we have discussed in previous editions of Statistics Count, there are products that are growing their share within a total that is not changing much (that’s the peak capacity at work). Now, that means there are products that are falling out of sales favour, and again, by extension, are being produced in smaller quantities.
Its robbing the one, to pay the other. But, there is something here that needs constant and further examination. What’s the driver for the swing from one grade to another, especially in a buoyant market? Well, if demand is net-net, then it is all about money through the supply chain, where the marginal net revenue is higher from producing one product than from another.
Sounds simple, but there is a lot to ponder in where, how and when those decisions are taken.
Meantime, it is important to assess the winners and losers among the grades.
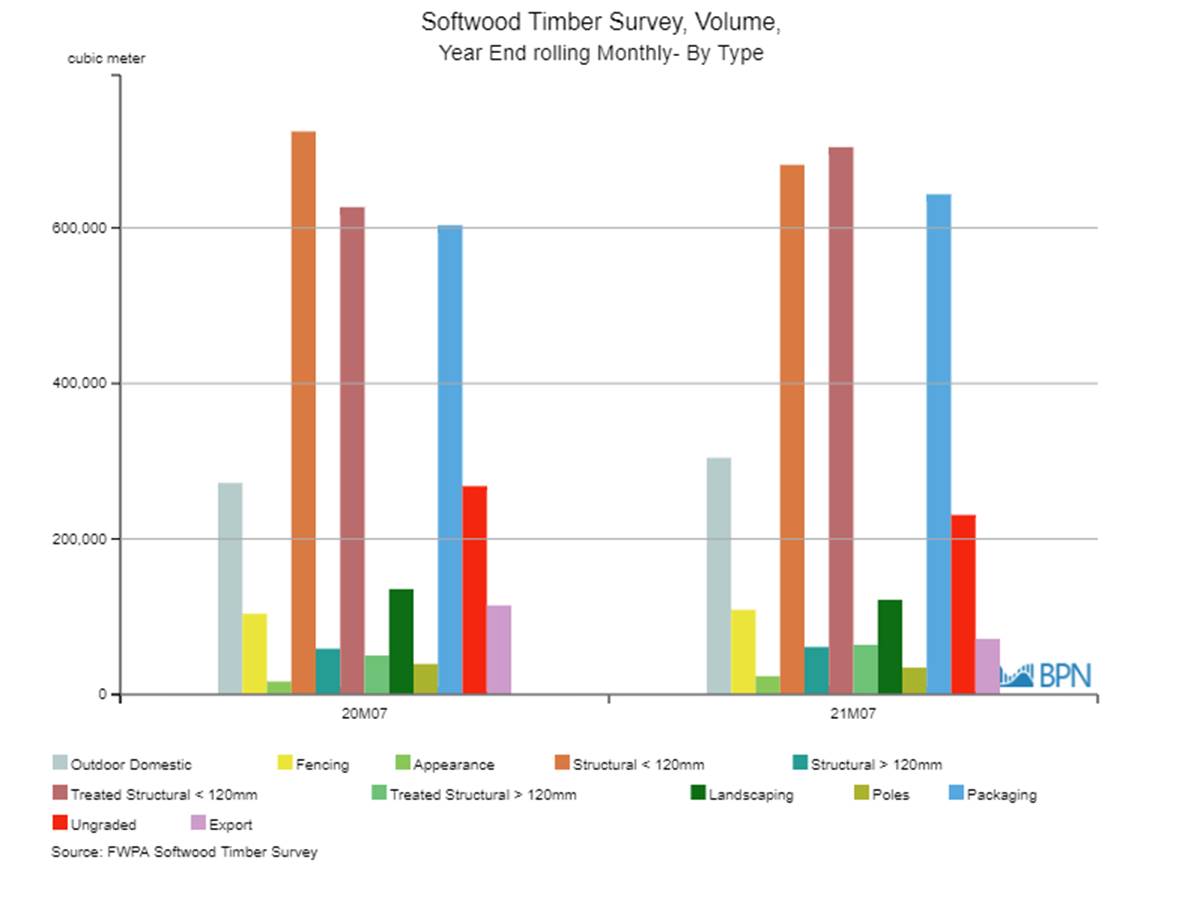
The chart gives us some clues about the ‘in favour’ grades: Treated Structural <120 mm and Packaging in particular, but what of the grades experiencing sales/production declines? The table provides some answers.
|
YE Jul ’20 |
YE Jul ’21 |
% Change |
|
|
Outdoor Domestic |
272,101 |
304,412 |
11.9% |
|
Fencing |
103,880 |
108,871 |
4.8% |
|
Appearance |
16,649 |
23,624 |
41.9% |
|
Structural < 120mm |
724,091 |
681,141 |
-5.9% |
|
Structural > 120mm |
58,906 |
61,090 |
3.7% |
|
Treated Structural < 120mm |
626,790 |
703,923 |
12.3% |
|
Treated Structural > 120mm |
50,182 |
63,867 |
27.3% |
|
Landscaping |
135,548 |
121,770 |
-10.2% |
|
Poles |
39,291 |
34,585 |
-12.0% |
|
Packaging |
603,552 |
643,224 |
6.6% |
|
Ungraded |
267,963 |
230,864 |
-13.8% |
|
Export |
114,640 |
71,601 |
-37.5% |
|
Total |
3,013,593 |
3,048,972 |
1.2% |
First, we cannot ignore the rise in sales of the Outdoor Domestic grades. Up 11.9% to 304,412 m3, they too have been allocated capacity that came from somewhere.
It is likely that some of the Treated Structural <120mm increase of 12.3% came from its untreated sibling (down 5.9%). That seems a direct swap and notably, the treated grade now dominates over the medium and short term.
Grades that appear to be on the ‘de-selection’ list compared to potentially higher value products are fairly evident: Landscaping (-10.2%), Poles (-12.0%), Ungraded (-13.8%) and especially Export (-37.5%). They are all under pressure for at least one reason: producers make more money – even if only marginally – from other products.
This evolution could devolve, of course. But, with a largely static supply of softwood logs limiting production capacity and demand that continues to grow incrementally over the long term, the economics of the situation suggest that lower value grades will see their presence in the market diminish further as time passes.
")

")
")
