
Australia’s sawn softwood imports lifted to 48,651 m3 in February 2021, a six-month high and a rise of 18.5% on January’s imports. February’s average import price was AUDFob531/m3, stable with the prior month. Considered annually, imports totalled 500,727 m3 for the year-ended February 2021, up 5.5% on the year prior.
As the chart shows, imports have not, in aggregate. Been able to reach up towards the levels seen towards the end of 2018, but do now appear to be growing their presence in the domestic market.
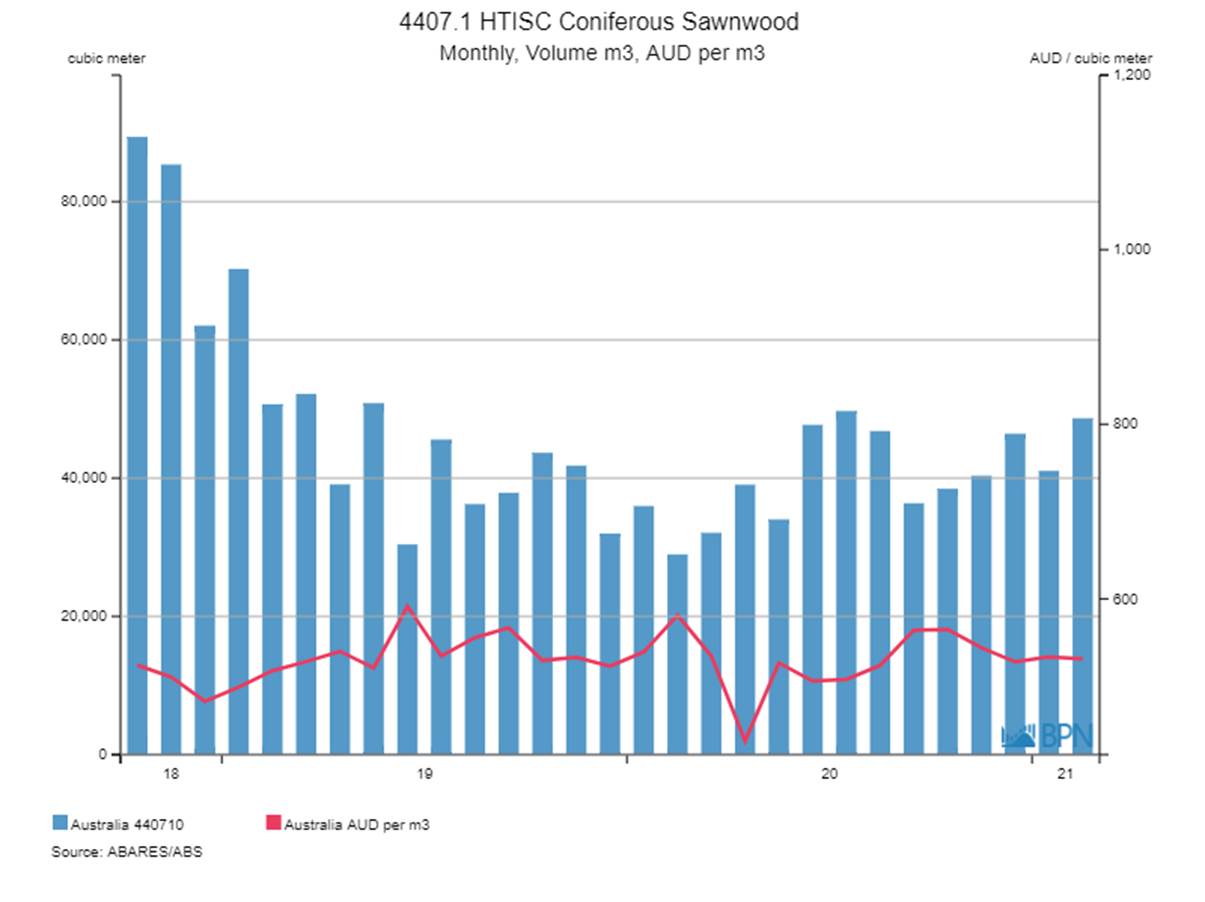
To go straight to the dashboard and take a closer look at the data, click here.
The constraints on increased imports are more than the obviously super-heated US market and its extensive demand that is drawing large amounts of resource to it. Many in industry point to the low average prices achieved for sawn softwood products – both domestically produced and imported – as being a limiting factor for those considering supply into the Australian market.
Other factors are at play right now, as the pandemic continues to wreak its wicked havoc across the globe. Shipping and freight costs, and timeframes for delivery, have blown out to up to fourteen weeks for shipments ex-Europe, with trans-shipment, blank sailings, and the Suez Canal jam up good examples of the challenges faced in shipping to the far ends of the earth.
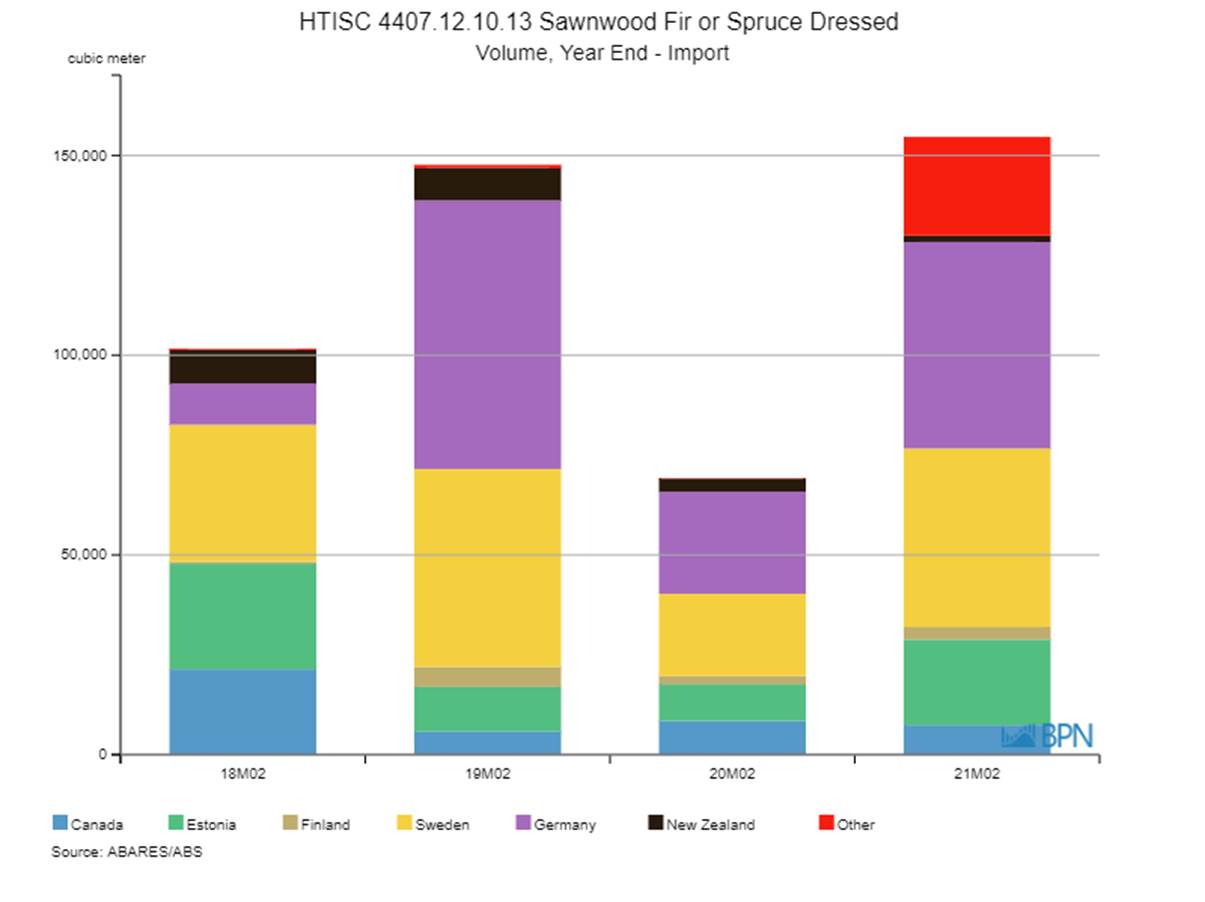
The second chart shows the grades of sawn softwood for which imports have been rising. The main grades have been highlighted to make them easier to identify. They are essentially the major structural grades:

To go straight to the dashboard and take a closer look at the data, click here.
For the most part, it is these major grades that have seen the increases, but in aggregate, not each separately, as the table below demonstrates.
|
Grade |
YE Feb ’20 |
YE Feb ’21 |
% Change |
|
4407.11.10.23 |
3,408 |
881 |
-74.2% |
|
4407.11.10.30 |
13,367 |
14,683 |
9.8% |
|
4407.11.10.31 |
33,887 |
41,671 |
23.0% |
|
4407.11.10.32 |
28,849 |
31,497 |
9.2% |
|
4407.11.10.40 |
165,079 |
130,520 |
-20.9% |
|
4407.11.99.01 |
12,108 |
11,385 |
-6.0% |
|
4407.11.99.02 |
25,927 |
11,429 |
-55.9% |
|
4407.11.99.03 |
3,063 |
3,408 |
11.3% |
|
4407.11.99.04 |
71,952 |
67,567 |
-6.1% |
|
4407.11.99.10 |
4,269 |
4,505 |
5.5% |
|
4407.11.99.11 |
978 |
926 |
-5.3% |
|
4407.11.99.12 |
1,082 |
1,484 |
37.1% |
|
4407.12.10.13 |
69,234 |
154,633 |
123.3% |
|
4407.12.91.14 |
431 |
242 |
-43.9% |
|
4407.12.99.15 |
1,195 |
499 |
-58.2% |
|
4407.12.99.16 |
205 |
556 |
171.3% |
|
4407.19.10.17 |
17,406 |
7,115 |
-59.1% |
|
4407.19.91.90 |
12,982 |
12,084 |
-6.9% |
|
4407.19.99.91 |
5,722 |
2,257 |
-60.5% |
The really big upwards mover has been the 4407.12.10.13 grade – Fir or Spruce, Planed or Sanded. It has more than replaced the 4407.11.10.40 grade – Pine, Planed or Sanded. So, there has been some shift between sub-species of supply of dressed sawn structural softwood products.
Leave aside the relatively modest (and as it happens, widely distributed among the supplier countries) decline in the ‘Pine’ grade, it is of interest to see from where the increased Fir and Spruce is being delivered. Below we can see that over the year-ended February 2021, most of the major suppliers increased their positions.
To go straight to the dashboard and take a closer look at the data, click here.
Shipments from Sweden lifted 118% to 44,687 m3, from Germany shipments rose 103% to 51,698 m3 and from Estonia, they rose 132% to 21,371 m3. Far from leaving the local market to its own devices, major importers are demonstrably doing all they can to raise their supplies to Australia. Their efforts will be all the more necessary as the long pipeline of work continues to be built over the next two years.
")

")
")
")