
Local softwood timber sales up 9.2% in 2020 [1 of 3]
Sales of locally produced sawn softwood lifted 9.2% in 2020, rising to 3.117 million m3, as the local industry responded to the unexpected ramp-up in demand caused by the HomeBuilder stimulus program. Underscoring the extent and breadth of the demand, the only ‘grade’ that failed to record an increase was the ‘Ungraded’ volume.
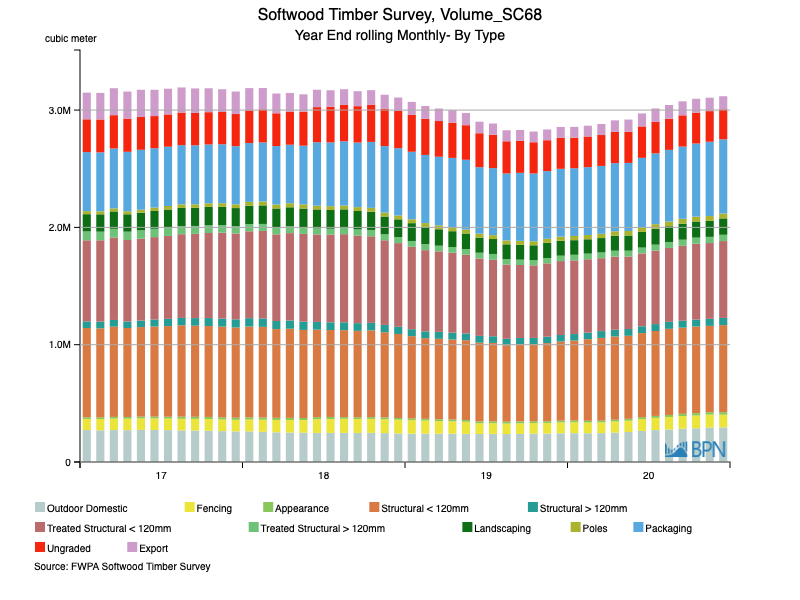
The chart below shows the monthly, moving annual sales volume. Importantly, when it comes to market signals, it can be observed that the rise in local sales actually commenced in the second half of 2019, well before the pandemic commenced.
To go straight to the dashboard and take a closer look at the data, click here.
As we foreshadowed above and shown in the table below, the only grade that did not see an annual increase was the ‘Ungraded’ volume. Even it declined just 3.1% or a little less than 12,000 m3. Not much in it, really.
Other grades fared particularly well over the year, with the combined structural grades experiencing growth of 7.5% and extending their total sales to 1.512 million m3 (48.5% of total sales).
Details can be seen in the table below.
|
Grade |
2019 |
2020 |
% Change |
|
Outdoor Domestic |
244,700 |
294,696 |
20.4% |
|
Fencing |
92,801 |
108,828 |
17.3% |
|
Appearance |
15,000 |
21,400 |
42.7% |
|
Structural < 120mm |
674,354 |
741,864 |
10.0% |
|
Structural > 120mm |
55,529 |
61,096 |
10.0% |
|
Treated Structural < 120mm |
630,268 |
655,450 |
4.0% |
|
Treated Structural > 120mm |
45,977 |
53,703 |
16.8% |
|
Landscaping |
127,302 |
139,606 |
9.7% |
|
Poles |
35,330 |
41,197 |
16.6% |
|
Packaging |
577,893 |
632,581 |
9.5% |
|
Ungraded |
264,027 |
255,856 |
-3.1% |
|
Export |
92,814 |
111,618 |
20.3% |
|
Total |
2,855,996 |
3,117,894 |
9.2% |
The next item in this set of three, addresses how weighted average prices have moved for some key grades of sawn softwood products.
")

")
")
")