
Australia’s sales of sawn softwood were up 8% year-ended March 2021. At a total 3.112 Mm3, sales are closing in on the all-time record. Battling to meet runaway demand, local producers have been pulling the stops out for most of the last year, producing at something close to capacity*.
*Please note capacity is a slightly variable term reflecting logs available and shifts scheduled at the time.
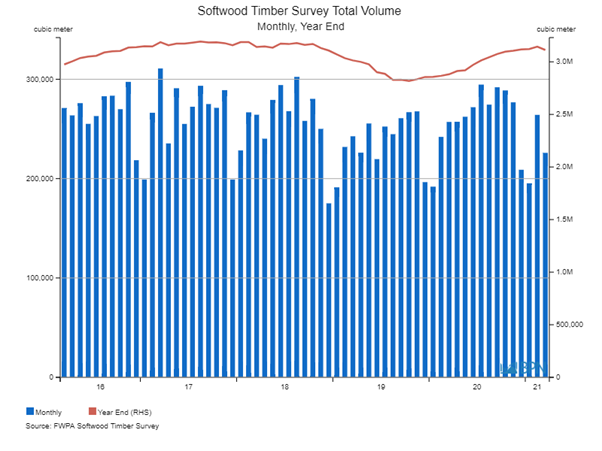
As the chart below shows, annual sales (the red line) moved up toward their all-time high by early 2021. Although sales moderated slightly in March, that was off the back of February sales that were themselves near all-time highs at 264,159 m3.
The chart shows that throughout most of 2020, sawmills worked to progressively supply and sell more sawn timber into the market, getting close to what has long seemed the theoretical average limit of about 300,000 m3 per month. Notably, sales in December were the highest for four years and the third highest on record at 208,909 m3 and January sales were also the third highest on record at 191,913 m3.
Fig21
To go straight to the dashboard and take a closer look at the data, click here.
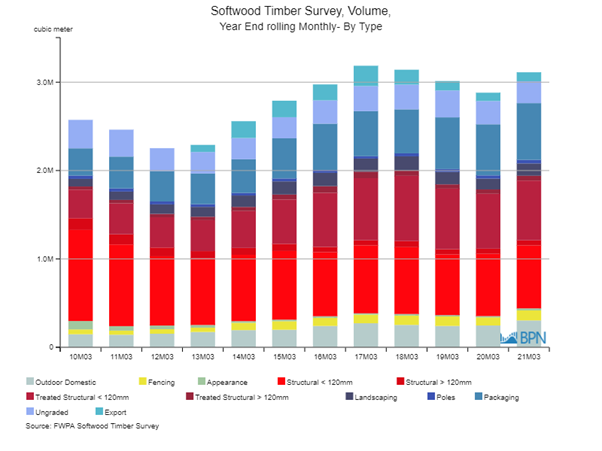
To see what the sawmillers are doing to meet demand from the housing sector right now, it is important to examine what products are being sold. The chart here has been adjusted to show the Structural products (treated and untreated) in the same red colour, with other products more muted.
Fig22
To go straight to the dashboard and take a closer look at the data, click here.
The first point to note is that year-ended March, total sales were at their third highest level on record.
Second, as we can also see in the table below, sales of aggregated Structural grades (treated and untreated) were outstripped for the third successive year, by sales of the ‘Other’ grades combined. The full table is provided further below.
Fig23
|
2010M03 |
2017M03 |
2018M03 |
2019M03 |
2020M03 |
2021M03 |
|
|
Structural |
1,522,764 |
1,603,398 |
1,623,702 |
1,479,752 |
1,433,534 |
1,500,866 |
|
Other |
1,050,900 |
1,582,741 |
1,517,417 |
1,533,485 |
1,447,681 |
1,611,423 |
At the same time as working to meet demand for structural timber, sawmills have also been selling to meet the market, and it is instructive that includes solid growth in the Outdoor Domestic and Fencing grades (both up 23% year-on-year) and 14% growth for the Landscaping grade. Once a house is built, the home requires its externalities to be looked after as well.
A special mention has to be made of the Packaging designation, sales of which grew 11% year-ended March. This is an important grade, accounting for the third largest total volume of sales (642,258 m3 year-ended March 2021). As challenges accessing hardwood resource continue for pallets and cases, the demand for softwood packaging materials is growing to fill an expanding market.
Meantime, constrained by capacity and possibly by the available logs, Structural grades all so sales grow, but by as little as 1% (for the Untreated grades) and as much as 9% for the smaller dimension Treated grade.
Ultimately, what the sales data appears to show is a continuing effort to supply a market that has growing (and dramatic) demand for most grades of sawn softwood. Available log supply and the somewhat related processing capacity are the constraint. The latter would be relatively easily fixed, so long as the former was about to materialise.
Fig24
|
2010M03 |
2017M03 |
2018M03 |
2019M03 |
2020M03 |
2021M03 |
|
|
Outdoor Domestic |
147,517 |
272,024 |
252,851 |
241,470 |
246,281 |
303,705 |
|
Fencing |
54,672 |
97,903 |
105,867 |
107,340 |
92,053 |
113,237 |
|
Appearance |
95,086 |
14,376 |
17,910 |
15,270 |
14,349 |
23,426 |
|
Structural < 120mm |
1,030,601 |
769,177 |
756,225 |
686,019 |
705,206 |
711,712 |
|
Structural > 120mm |
132,756 |
57,127 |
68,927 |
59,081 |
57,769 |
58,441 |
|
Treated Structural < 120mm |
323,466 |
703,340 |
738,906 |
686,643 |
621,653 |
676,234 |
|
Treated Structural > 120mm |
35,941 |
73,755 |
59,645 |
48,009 |
48,906 |
54,479 |
|
Landscaping |
85,985 |
148,296 |
160,853 |
140,287 |
122,738 |
139,666 |
|
Poles |
36,616 |
26,194 |
33,808 |
33,081 |
36,394 |
40,207 |
|
Packaging |
309,380 |
510,157 |
498,099 |
584,902 |
578,549 |
642,258 |
|
Ungraded |
321,643 |
284,179 |
279,536 |
304,427 |
263,364 |
247,737 |
|
Export |
– |
229,611 |
168,493 |
106,709 |
93,953 |
101,187 |
|
Total |
2,573,664 |
3,186,139 |
3,141,119 |
3,013,237 |
2,881,214 |
3,112,290 |
")

")
")
")