Evidence is mounting that sales of domestically sawn softwood are peaking. At 2,690,700 m3 for the year to end April 2015, sales are 3.0% higher than they were for the year to end April 2014, although sales for the first four months of 2015 are down 7.2% compared with the same period in 2014. Sawn softwood sales peaked at 2,754,000 m3 for the year ended December 2014. With imports having risen substantially over the last year, flat growth in domestic sales suggests there is little capacity for expansion on the supply side.
Demand for sawn softwood is clearly very strong. The domestic suppliers appear to be operating at capacity of around 2,600,000 m3 per annum. As a response to the demand strength and the opportunities it presented in the market, producers reigned in exports by 35.2% for the year to end April 2015, compared with the prior year. That added 75,000 m3 to domestic supply.
As the chart below shows, year-end sales dipping from the December 2014 peak, as moderately lower monthly sales have begun to work their way into the rolling annual data.

For further details, go to the FWPA Data Dashboard.
However, monthly data continues to show solid growth on a year-on-year basis, for most major grades. For instance, the largest grade, Structural <120 experienced 2.2% growth from the year to the end of April 2014 to the year to the end of April 2015. This is an annual lift of more than 16,500 m3, in its own right, but it is dwarfed by other grades, as the table below shows for some selected grades.
| Grade | YE Apr ’14 | YE Apr ‘15 | Vol Change | % Change |
| Fencing | 87,303 | 96,805 | 8,502 | 10.9 |
| Structural <120 | 754,201 | 770,653 | 16,452 | 2.2 |
| Structural >120 | 77,674 | 82,537 | 4,863 |
6.3 |
| H2F | 456,761 |
536,824 | 80,063 | 17.5 |
| Landscaping | 132,557 | 150,537 | 17,980 | 13.6 |
| Poles | 29,196 | 32,043 | 2,847 | 9.8 |
| Packaging | 384,912 | 426,420 | 41,508 | 10.8 |
The data above, all of it positive, is effectively a year-long retrospective on the state of sales of softwood products. By the end of 2015, any growth is likely to be more muted, now that apparent peaks have been reached.
Returning to the detailed monthly data, it is pertinent to consider the major grades and their performance in April 2015, compared with that for April 2014. The table below differs from the one above because it compares the single month of April 2014 with April 2015.
| Grade | Apr ’14 | Apr ‘15 | Vol Change | % Change |
| Fencing | 6,777 | 7,725 | +948 | +14.0 |
| Structural <120 | 61,702 | 57,440 | -4,261 | -6.9 |
| Structural >120 | 6,074 | 5,716 | -358 | -5.9 |
| H2F | 37,599 | 44,027 | +6,429 | +17.1 |
| Landscaping | 11,002 | 11,783 | +781 | +7.1 |
| Poles | 2,846 | 2,524 | -322 | -11.3 |
| Packaging | 32,430 | 36,599 | +4,170 | +12.9 |
This closer examination allows a couple of preliminary conclusions.
First, the substitution between Structural <120 and H2F is evident. Combined in April 2014, they totalled 99,301 m3, but 101,467 m3 in April 2015. What looks like very steep growth of H2F is a more muted 2.2% when combined with its major, similar grade.
Second, and taking the first point into account, it is observable that the grades associated with the back-end of housing development (fencing and landscaping) have performed particularly well over the year to April 2015, along with packaging. The inference that may be drawn from this is that rising imports are particularly focussed on structural timbers and less on those other high-growth products. That is supported by the import data.
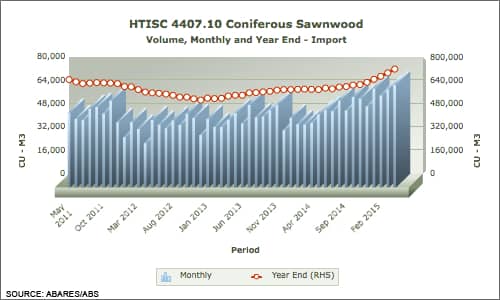
As a result of sawn softwood having reached apparent production and sales peaks, already strong imports have stepped in to fill the gap between domestic supply and demand. As a result, for the year to end April 2015, sawn softwood imports rose 24.0% compared with the prior year, reaching a record 717,000 m3. In addition, as the chart below shows, April 2015 was itself a record month, with imports totalling 70,500 m3, more than 58% higher than in April 2014.

For further details, go to the FWPA Data Dashboard.
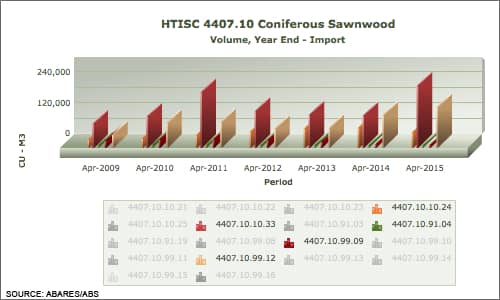
As described above, the import emphasis is on structural grades. Although this is to be expected, it is worthy of note. The chart below shows the major grades of imports, with the red bars charting the history of dressed, sawn softwood (4407.10.10.33) and the tan coloured bars showing roughsawn softwood <120 mm (4407.10.99.12) Other products have been selected from a large list of softwood products, based on their significance to imports, largely for comparative purposes.

For further details, go to the FWPA Data Dashboard.
Australia’s booming demand for softwood products has resulted in imports of dressed sawn softwood growing a furious 93.5% for the year to end April 2015, compared with the prior year, with imports totalling 241,300 m3. Although experiencing softer growth of 24.9% over the same period, roughsawn softwood <120mm imports have grown to 157,000 m3. Both are records and these are not the only products where import records are being set.
By any measure, production, imports and exports of sawn softwood are all playing their part in meeting booming Australian demand.
It is important to always look beyond the headline sales of sawn softwood to the individual grades, to get a sense of both, what has happened, and what will happen. Having considered import growth and its role in sawn softwood supply, it is also relevant to consider the state of exports, as the next two items do, showing that exports of both woodchips and logs are strong and growing.


