
With the activity data for our industry continuing to surprise, I am having to go back to the 60s to find a suitable musical equivalent to describe the current situation. Some of you may remember it – “The Pipeline” by The Chantays from 1962. It’s not just the summer and the sun, but we can now see work building in the pipeline.
The industry had done a magnificent job during the early months of COVID 19 in pulling work forward to maintain building activity. However, given the big hit to the economy, in the June quarter where overall economic activity declined a record 7%, the challenge was always how to backfill the pipeline.
This was particularly pertinent to our industry given the collapse in net migration which traditionally is a big driver of household formation rates. Net migration is expected to be down -72,000 in the 2020/21 financial year compared to +154,000 in 2019/20.
Pleasingly, as can be seen in the recent Building Activity data, the trend is upward.
To go straight to the dashboard and take a closer look at the data, click here.
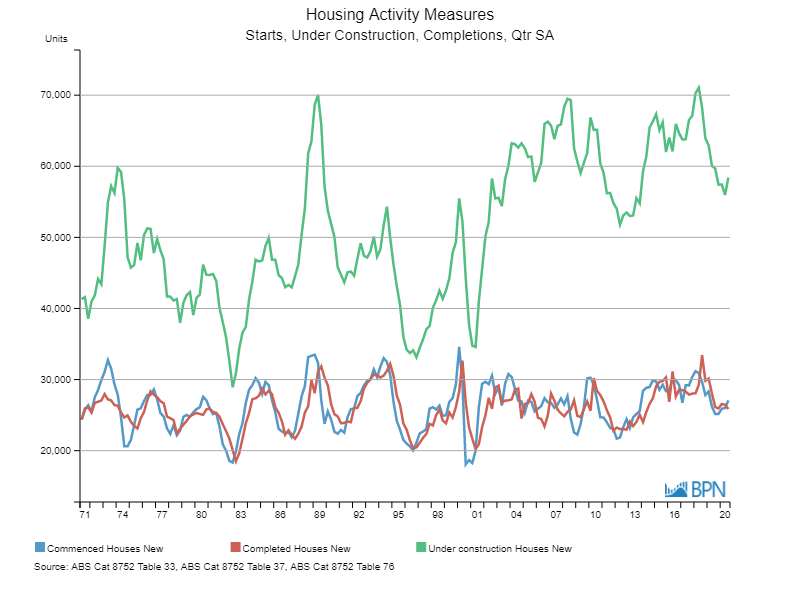
After a run down from the peak of the last housing cycle in mid-2018, new houses under construction (the green line) have moved up to 58,399 in the Sept quarter. This represents a change of +4.3% from the previous quarter. The reason for this is that housing starts were up (blue line) at 27,067 while completions (red line) were down at 25,851.
While the December quarter for this data series is not due until April this looks like the beginning of an upward trend. Supporting this outlook is the strength of dwelling approvals which in December were 19,537 (up +10.9% in November) and +22.8% in the same period 12 months ago. There was an even more stellar performance for detached houses; 13,785 in December, an increase of +14.9% on the previous month and up 55.4% on 12 months ago.
This is backed up by housing finance with loan commitments in December (excluding refinancing), of $26.006 billion. Of direct interest to our industry, is loans for construction and purchase of new houses which were $6.448 billion in December up +61% on the equivalent period 12 months ago.
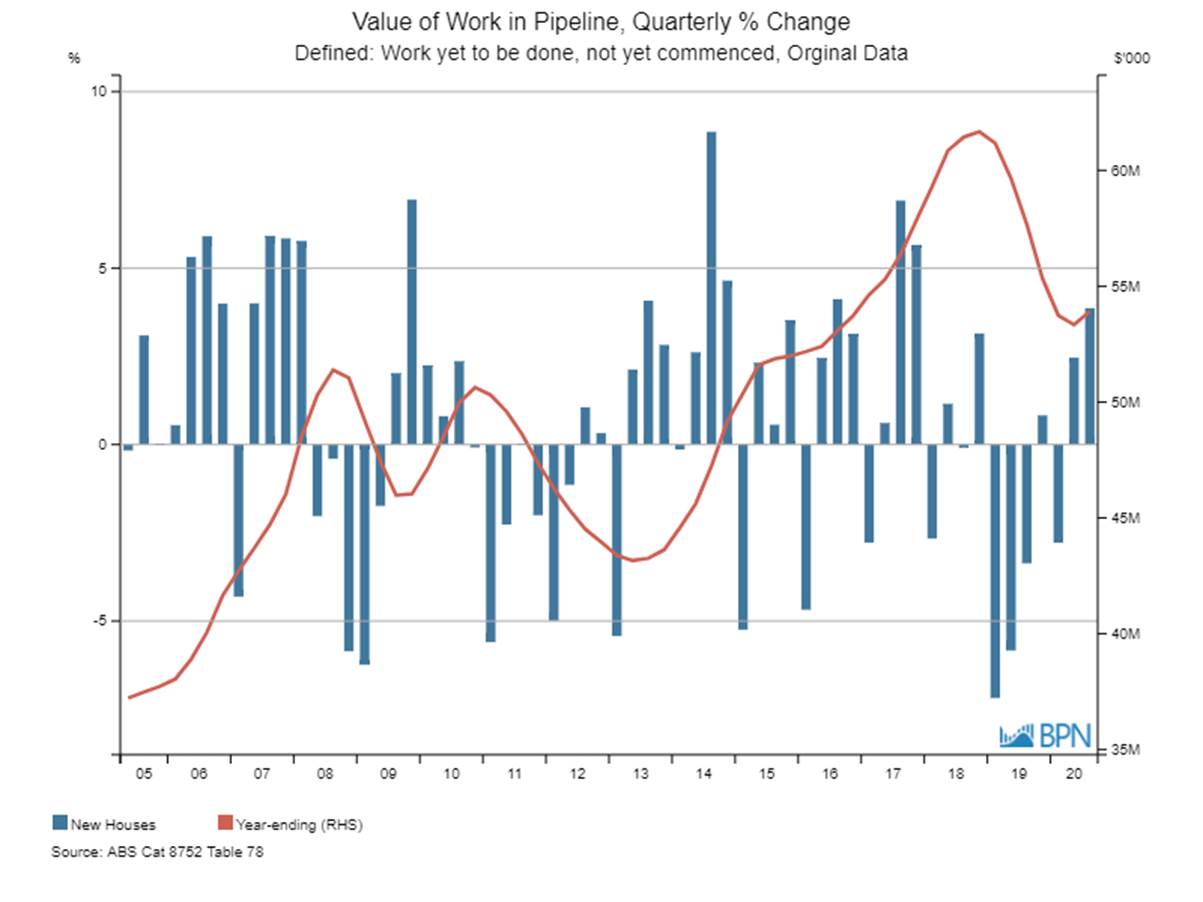
All of this positive news is reflected in the official work in the pipeline data which is defined as work, yet to be done, and not yet commenced.
To go straight to the dashboard and take a closer look at the data, click here.
For the September quarter this was $13.934 billion for new houses a change of +3.9% on the previous quarter. That is a lot of housing to build!
So, given the challenges the economy is working through – how is it so?
As mentioned in previous columns, the government has provided significant support with programs such as Jobkeeper having a positive impact on employment. In addition, the RBA has been effective in providing liquidity to the banks and keeping interest rates low. Specific to housing has been the HomeBuilder program, which provided cash incentives of $25,000 for contracts signed by 31 December 2020. This program has now been extended to 31 March at a reduced level of $15,000.
With people in jobs, or at least transitioning back to work, plus low interest rates, there is clearly confidence in the market, which is generating strong demand. This is despite the reduction in traditional drivers such as net migration.
However, at the end of March, the liquidity the government has been providing – over $50 billion a quarter – will cease. As well as JobKeeper, other initiatives in the economy such as bank mortgage deferrals and the retail tenancy moratorium will also end. The expectation of policy makers is that consumer spending and business investment will fill the gap. This may mean the recovery is patchy with some sectors doing better than others. At this stage the data for new housing suggests we have enough demand “baked in” to move through 2021 in good shape.
So, while you are hanging ten to the sounds of “The Pipeline”, keep an eye on the changes coming in March.
")

")
")
")