
If there is a paradox in the modern supply of wood products in Australia, it is surely that consistent demand is met by domestic production, supported by imports, while log exports chalk up new records almost every month. The practicalities of this situation have seen reported supply lead-times pushing out further, implying that the gap between demand and supply is rising. But like most things in global trade, it is somewhat more complex than that.
FWPA’s Statistics & Economic Manager, Jim Houghton, has recently analysed and presented to industry on this topic. A summary of his presentation provides several points of illumination.
Any analysis of wood products demand must have, at its core, treatment of housing demand. While latest data is included elsewhere in this edition of Statistics Count, it is important to note that Free-standing or detached houses are very resilient in the Australian economy. Although, as the housing boom has ended, they have experienced declines, they are far smaller than for the total, and certainly for high-rise apartment towers.
Moreover, the residual strength within the combined multi-residential dwellings is to be found in Townhouses, not in tower apartments. As the chart below shows, the boom in multi-residential dwelling approvals in Australia was fuelled almost entirely by Four + Storey apartments.
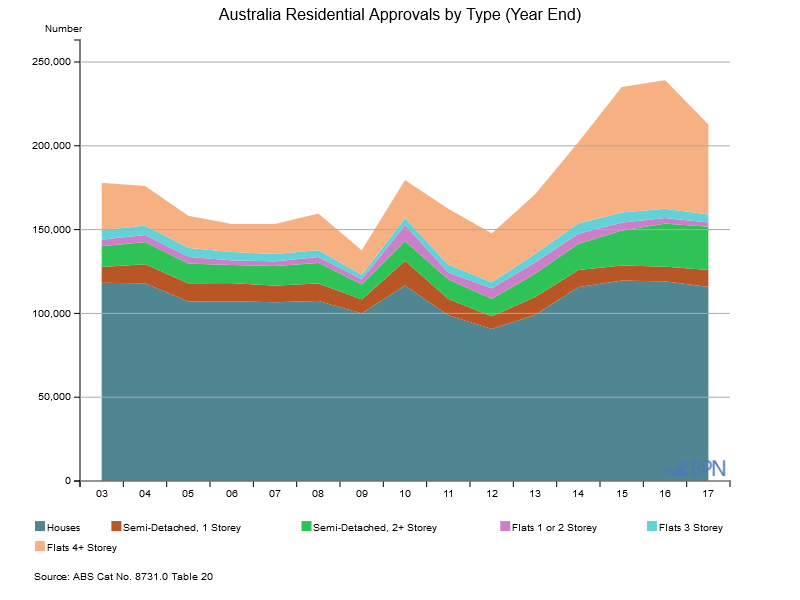
However, it is only when the boom comes to an end – as it clearly has with this chart that ends at December 2016 – that we look below the big volume and can observe the strength in the Townhouses or Semi-Detached dwellings, especially those of 2+ Storeys.
Over the thirteen years to the end of 2016, as the table below shows, annualized approvals of these dwellings have almost doubled.
| Dec-03 | Dec-16 | % change | |
| Total Dwellings | 177,941 | 228,728 | 29% |
| Detached | 121,547 | 117,019 | -4% |
| Semi-Detached, 1 Storey | 9,911 | 8,353 | -16% |
| Semi-Detached, 2+ Storey | 13,110 | 25,066 | 91% |
| Flats 1 or 2 Storey | 4,132 | 3,171 | -23% |
| Flats 3 Storey | 5,850 | 5,116 | -13% |
| Flats 4+ Storey | 23,389 | 70,003 | 199% |
Combined with Detached or Free-Standing dwellings, we can see the underlying drivers of demand for wood and wood products, more than clearly.
It is also important not to ignore the significance of Alterations and Additions as drivers of demand for wood products. Although the data is opaque – really all that is available is the value of this building activity – annual expenditure runs to around AUD9 billion on current measures, and has been strong and stable over the last two to three years.
We do know from FWPA’s recent market analysis of residential flat-pack joinery imports, that a significant portion of this expenditure goes on kitchens, bathrooms and laundries, including the panel products that are used in joinery.
The chart below shows Australia’s Alterations and Additions experience.

To go straight to the dashboard and take a closer look at the data, click here.
The result of the housing analysis is that we can expect a strong housing market – including reinvestments in alterations and additions – to be flowing through to sawn timber demand. We can see that flowing through into apparent consumption in the chart below.

It does seem that the current lift in consumption is below the 5.743 million m3 recorded in 2003-04, but inventory effects and other elements that can impact any derived calculation may be evident.
In some respects, we can see the strength in sawnwood consumption in the chart below, which shows sawnwood production, by species and in total. The area of particular interest is the sawn softwood production, which in 2015-16 was just 0.7% below its record of 4.458 million m3 set in 2014-15.

As discussed elsewhere in this edition of Statistics Count, there is increasing evidence that Australia’s sawn softwood production has peaked. At the same time, imports of sawn softwood have also been soft, leading into expectations that growing demand is not being met by supply.
The chart below shows Australia’s sawnwood imports.

The supply challenge is, in part, evidenced by longer lead times for supply, higher prices, and partial shipments.
Consistent with rising total sawnwood production, the profile of Australian sawlog production has also moved in similar fashion, as the chart below shows.

As the table below shows, since 2000-01, Australia’s sawlog production has increased by 1.187 million m3, but has done so against the backdrop of massive decline in the harvest from native forests (-690.8% or 1.615 million m3) and an even more massive increase in the harvest of softwood logs (+36.2% or 2.697 million m3).
| Sawlog Production | 2000–01 | 2007-8 | 2015–16 | Difference 2000 to 20016 |
| Native | 3,583 | 2,966 | 1,968 |
-1,615 |
| Hardwood Plantation | 82 | 186 | 187 | 105 |
| Softwood | 7,458 | 9,631 | 10,155 | 2,697 |
| Total | 11,123 | 12,783 | 12,310 | 1,187 |
So, domestic supply has been performing its primary function, and without disclosing information not in the public domain, we can observe that prices for sawnwood products are rising also. Average prices for the main grades of sawn structural timber have risen for the first time in two years, with progressive increases factored in, over the course of 2017.
Importers held out of market by low prices
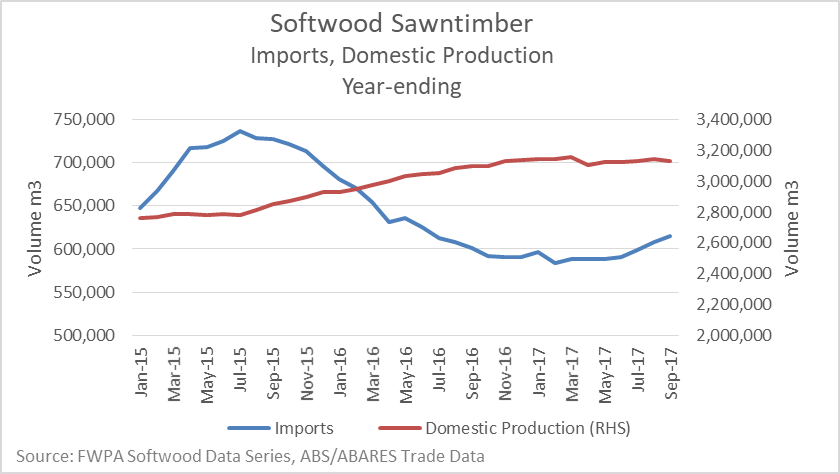
There is little doubt, as Jim Houghton’s data analysis demonstrates, that importers were held out of the market by low prices over the last couple of years. The relationship between imports and local production is shown in the chart below.
And as the chart below shows, it is little wonder importers chose to step out of the Australian market, especially for the majority whose transactions were or are denominated in US Dollars.
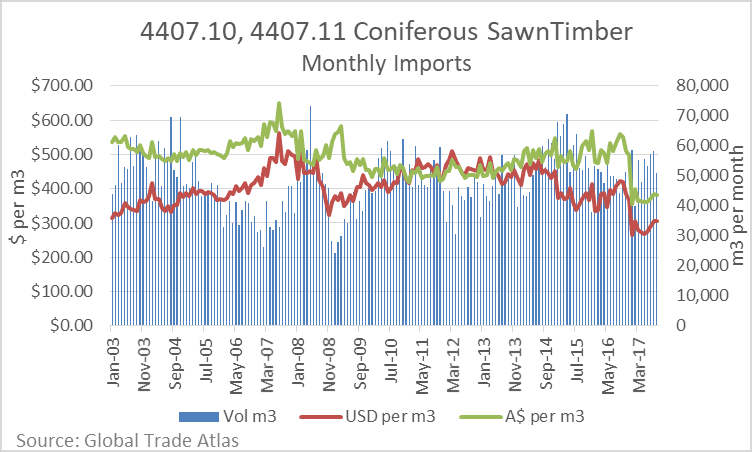
So reasonably, we can state that supply challenges are on the import side and appear to be a direct result of sales prices being too low. This is a local phenomenon with an international flavor.
As we will see in the next item, log prices are on the move in other regions of the world. Additionally, global pulp prices have increased over 2017. Wood fibre is more valuable than it was a year ago and trade flows are increasing in line with that price movement.
We can expect to see import prices for sawn softwood rise in coming months, against that backdrop, however, the domestic market has to take the lead on pricing. If it does take the lead, it may become a more competitive purchaser of domestic softwood logs, clawing back some of the softwood log exports that are now at record levels.
Plantation growth is the solution, but we need to get a wriggle on!
In the absence of higher imports, the critical question is how does supply reach up to match continually growing demand? Realistically, the only wood products answer – no one is prepared to countenance substitution by non-wood products – is to expand the supply base. That means harvesting more logs from the softwood plantation estate.
But the plantation estate is static and has been for some years. We can see the outlook on the plantation estate in the chart below.
Historic and Projected Plantation Establishment 1976-2050
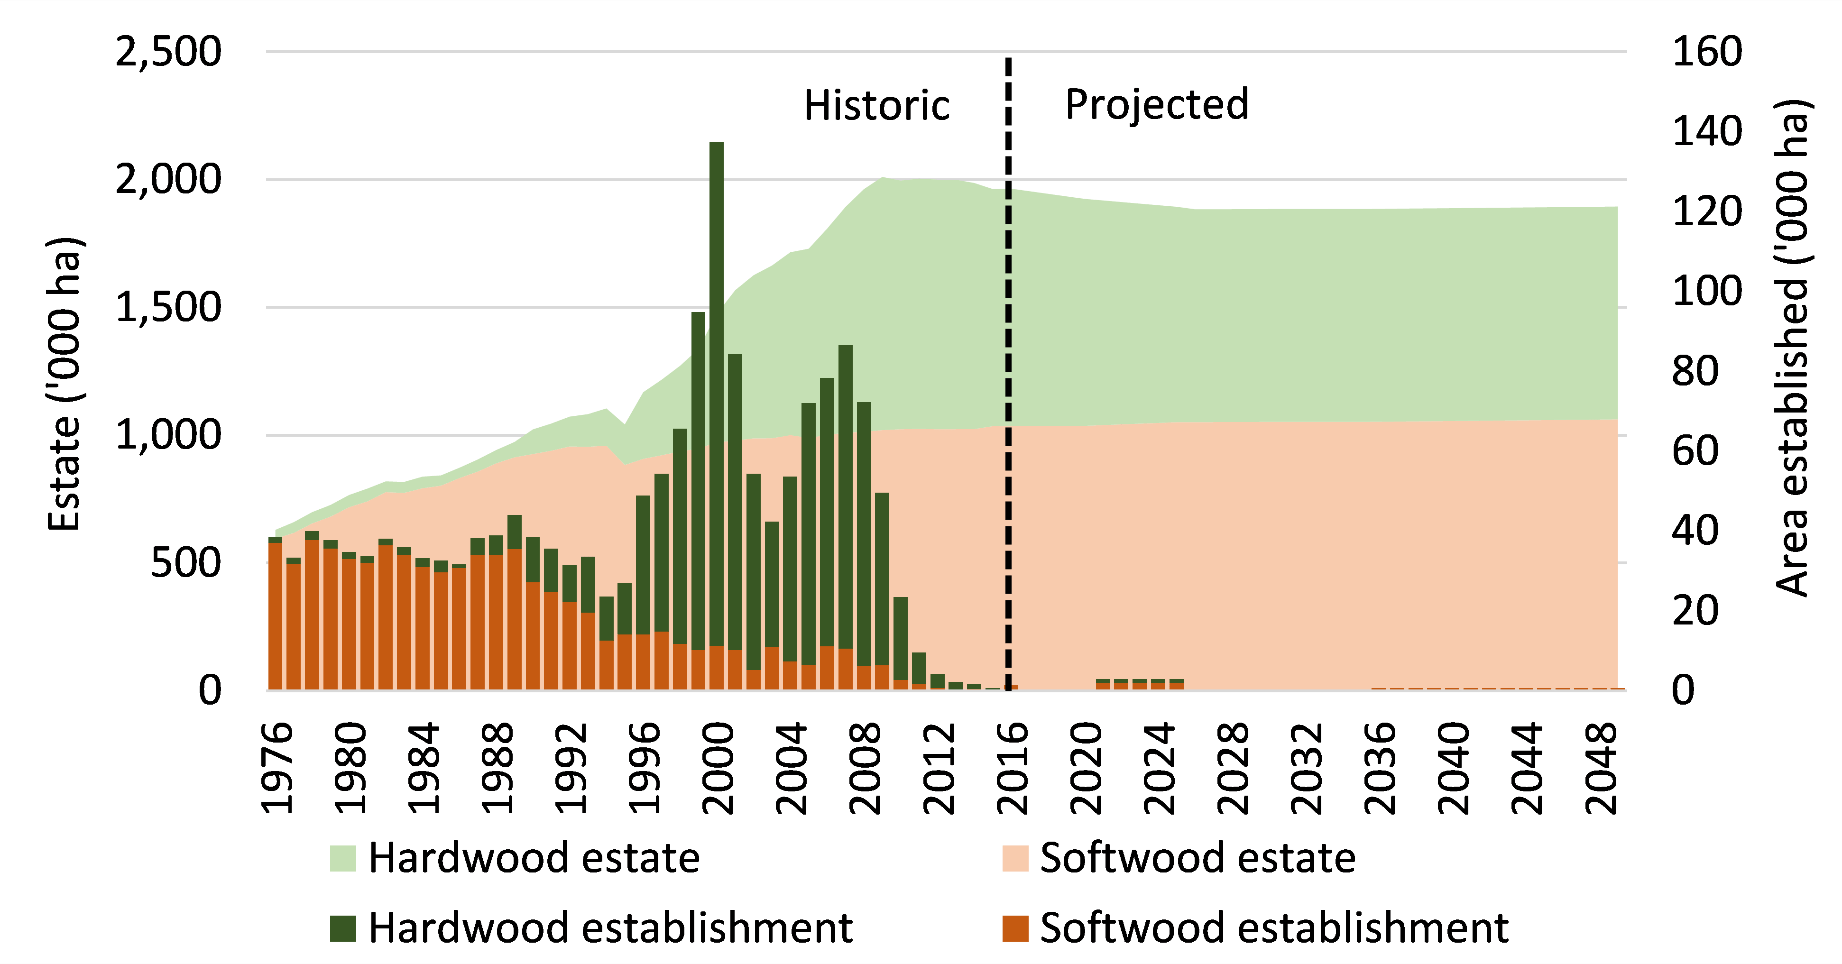
Even if the plantation estate were to be expanded, in the context of log exports being high and growing, there is no ‘ipso facto’ guarantee that additional plantations will result in an equivalent volume of domestic conversion into wood products.
Whether just increasing the size of the plantation estate will solve the wood products supply and demand problem is very much a moot point. One thing is for sure – none of that will occur unless the prices of logs and sawn timber increase.
")

")
")
