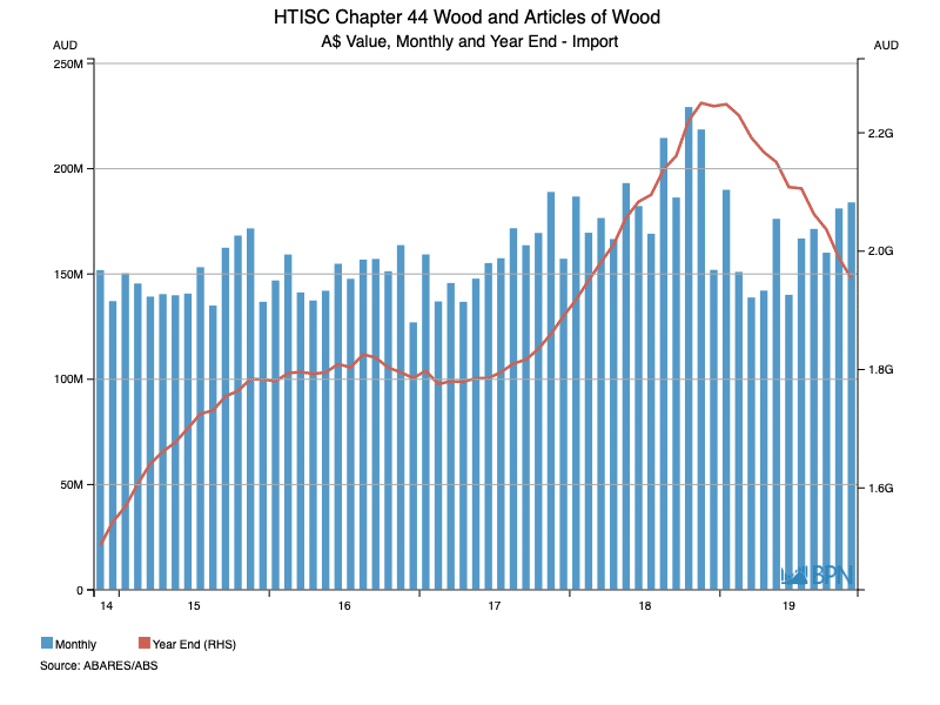
The value of Australia’s forestry and wood products imports continued to decline on a year-on-year basis in late 2019. Total imports were valued at AUDFob1.954 billion for the year-ended November 2019, 1.7% lower than a month earlier and down 13.2% on a year earlier. With the value of 35.5% and the volume falling by 38.9%, a serious adjustment to imports has occurred and needs to be considered, especially in a market that is due to turn up, later in 2020.
In the chart below, we can see that after rising steadily for the best part of four years, the value of imports peaked in late 2018 and since then has charted a downwards course.

Fig 6
To go straight to the dashboard and take a closer look at the data, click here.
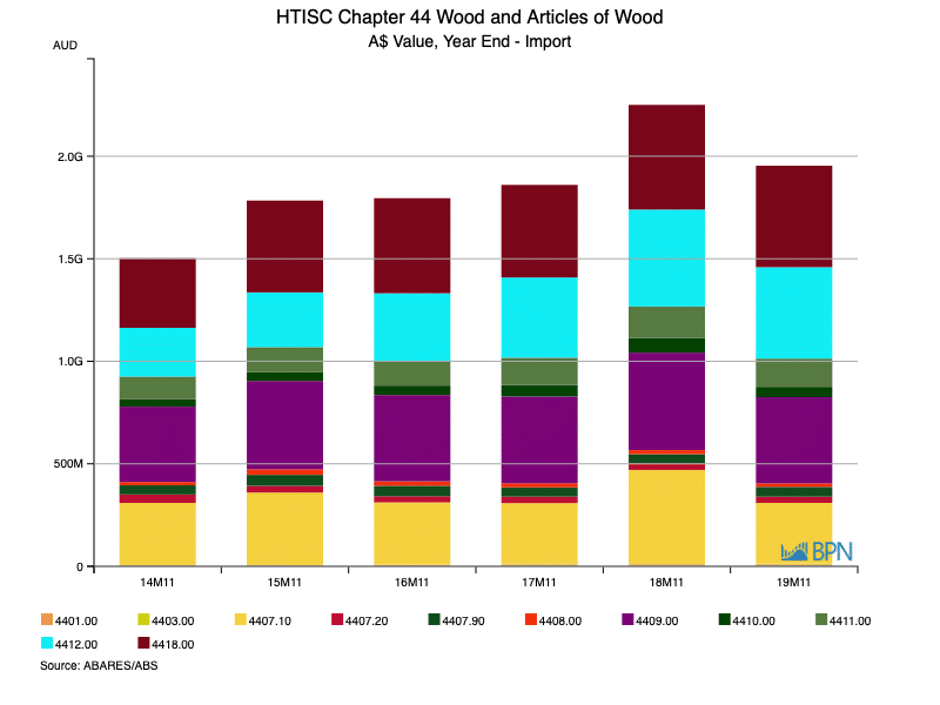
For emphasis, the second chart shows the value of imports for each of the last five years (year-ended November) on a major products basis. It emphasises the importance of 2018 overall, but also shows that by value, import values are split between sawn softwood (mustard yellow), mouldings (purple), plywood (light blue) and builder’s joinery (maroon).

Fig 7
To go straight to the dashboard and take a closer look at the data, click here.
To provide some further emphasis, the table below shows the value of imports for each of the last two years.
|
Description |
YE Nov ‘18 |
YE Nov ‘19 |
% Change |
|
4401 – Woodchips, pellets |
10,038,298 |
9,545,499 |
-4.9% |
|
4403 – Logs |
1,707,475 |
4,005,824 |
134.6% |
|
4407.1 – Sawn Softwood |
458,285,774 |
295,796,056 |
-35.5% |
|
4407.2 – Sawn Tropical |
32,281,471 |
30,175,333 |
-6.5% |
|
4407.9 – Sawn Hardwood |
44,947,811 |
48,046,222 |
6.9% |
|
4408 – Veneer |
19,594,078 |
16,097,738 |
-17.8% |
|
4409 – Mouldings |
475,395,948 |
421,192,156 |
-11.4% |
|
4410 – Particleboard |
70,523,561 |
50,735,354 |
-28.1% |
|
4411 – MDF |
154,666,679 |
137,487,982 |
-11.1% |
|
4412 – Plywood |
472,467,871 |
445,854,643 |
-5.6% |
|
4418 – Builders’ Joinery |
510,436,565 |
494,837,547 |
-3.1% |
The general value data is always of interest and it shows that with only small exceptions, all imports have experienced declining values over the last year. However, because of the competitive nature of the market for sawn softwood, we regularly focus attention on those grades and imports.
We can see that the value of sawn softwood imports declined by a significant 35.5% over the year-ended November 2019, so what of the volume imported? The table below shows that sawn softwood imports have fallen 38.9% on a volume basis over the same period, suggesting that on average, prices rose over the year. Notably, no other import line was impacted greater than sawn softwood, underscoring if nothing else the impact of a declining housing market on imports.
|
M3 Cubic Metres |
YE Nov ’18 |
YE Nov ’19 |
% Change |
|
4401 |
6,528 |
8,189 |
25.4% |
|
4403 |
1,392 |
4,820 |
246.3% |
|
4407.1 |
917,914 |
561,248 |
-38.9% |
|
4407.2 |
24,903 |
22,240 |
-10.7% |
|
4407.9 |
29,334 |
29,770 |
1.5% |
|
4408 |
10,209 |
14,085 |
38.0% |
|
4409 |
357,120 |
310,251 |
-13.1% |
|
4410 |
159,022 |
102,259 |
-35.7% |
|
4411 |
242,309 |
191,086 |
-21.1% |
|
4412 |
533,623 |
451,032 |
-15.5% |
|
4418 |
0 |
0 |
– |
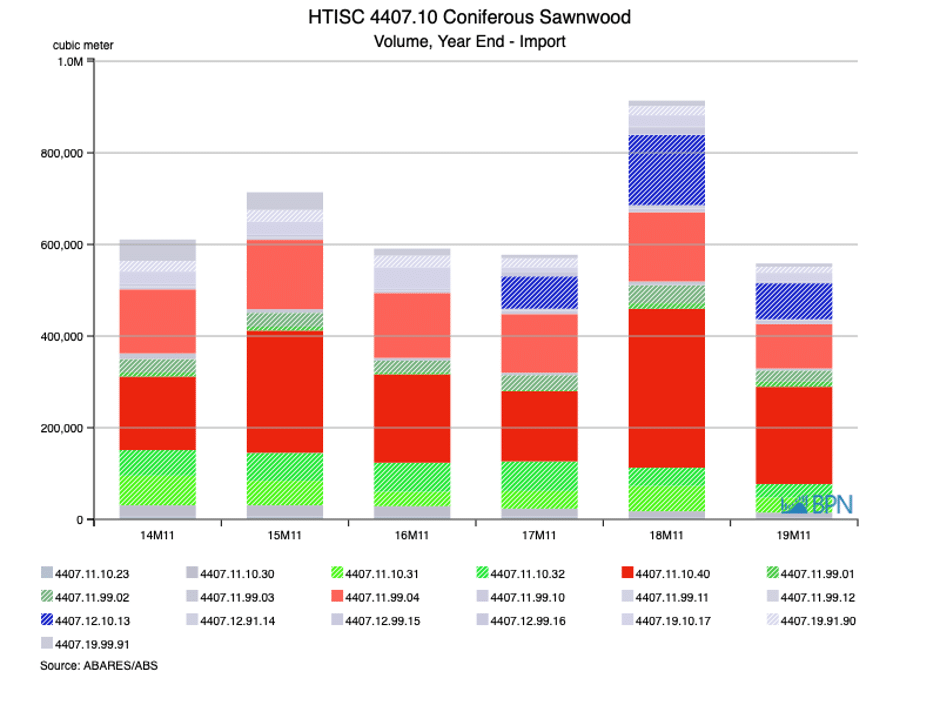
The next chart shows imports of sawn softwood, broken down to their grade level.
Grey Band – grades with imports less than 20,000 m3 over the last year
Red Band – different non-Radiata species
Green Band – different Radiata grades Indicating imports from New Zealand),
Blue Band – dressed fir and spruce imports.

Fig 8
To go straight to the dashboard and take a closer look at the data, click here.
The colour-coded table shows that all of the significant (greater than 20,000 m3 imports) grades of sawn softwood products – both dressed and roughsawn and treated and untreated – have experienced steep import declines. One way to think of this data, presented in this form, is that the items in green are mainly from New Zealand, those in red mainly from Europe and Scandinavia and in blue, from the Northern Hemisphere in general, but again with an emphasis on Europe and Scandinavia.
|
YE Nov 18 |
YE Nov ’19 |
% Change |
|
|
4407.11.10.31 |
55,059 |
32,838 |
-40.4% |
|
4407.11.10.32 |
40,063 |
29,498 |
-26.4% |
|
4407.11.10.40 |
346,734 |
212,124 |
-38.8% |
|
4407.11.99.02 |
39,487 |
24,316 |
-38.4% |
|
4407.11.99.04 |
150,935 |
96,870 |
-35.8% |
|
4407.12.10.13 |
152,852 |
78,511 |
-48.6% |
We know, and in this edition of Statistics Count, we again touch on the fact that the housing market and approvals and the new dwelling supply chain are the main driver for sawnwood consumption. But it is also worth examining the role of currency in import markets.
For much of the last two years, but in a fairly orderly manner, the Australian dollar has tracked lower against its major trading partners. The emphasis is typically on the US dollar, which is appropriate for the nation as a whole, and for most exporters and those facing import competition. But for the sawnwood trade, the Australian dollar’s relationship to the Euro is at least as significant.
The chart below shows that the Australian dollar has shifted downwards over the last year and certainly through to the end of January. The declines against the US dollar over the year-ended January 2020 are 7.5%, the Japanese Yen 7.3% and the Euro, a more muted 3.5%. In all, we might say that the depreciating Australian dollar has been mildly depressive of a desire to import, especially for the most competitive and highest volume products, like sawn structural softwood grades that dominate imports as the data above demonstrates.

Fig 9
To go straight to the dashboard and take a closer look at the data, click here.
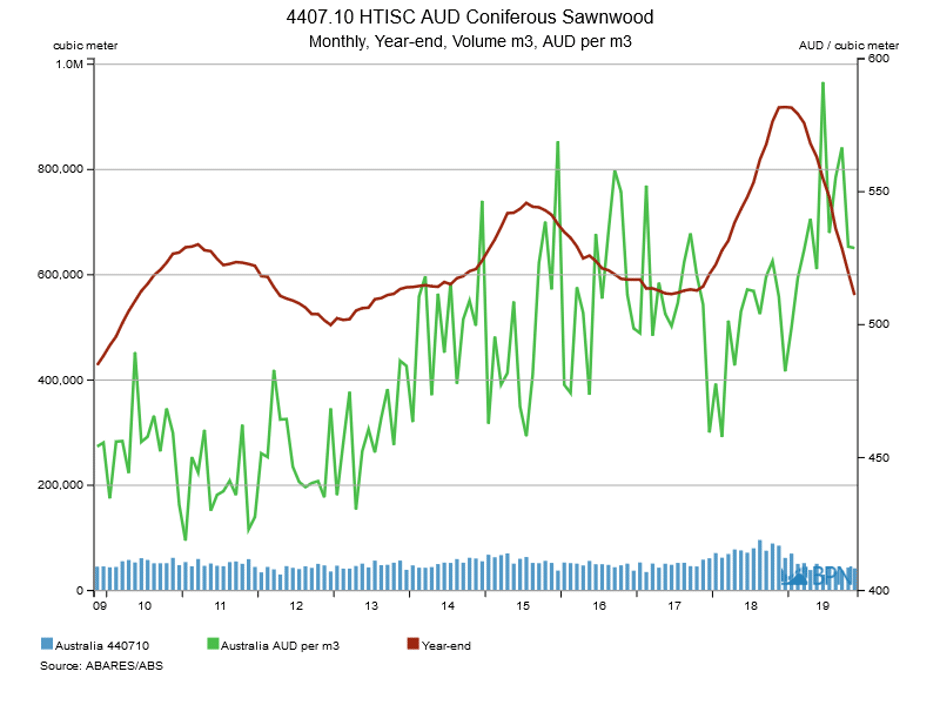
So, in the most recent market downturn, it is clear that imports of wood products have declined, both in value and volume terms, but with the price of imports holding up relatively well in Australian dollar terms. At the same time, the depreciation of the Australian dollar to the Euro has been relatively mild, seeming to account for at least most of the small increase in average prices.

Fig 10
To go straight to the dashboard and take a closer look at the data, click here.
It is interesting to note from the graph that the average price (green line) for all softwood imports (4407.10) at levels well above 2018 while at the same time volumes (red line) have eased to late 2017 levels. What that might suggest is that importers are pricing to their requirements and placing product into Australia on their expected terms.


