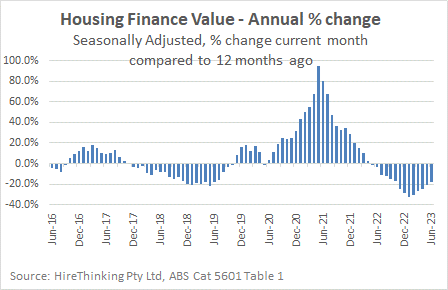
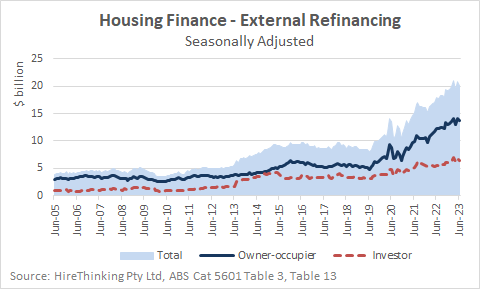
The value of housing loans in Australia was down 18.2% year-ended June but has improved from -30.7% for the year-ending January, suggesting the slump in total loan values is beginning to turn. These are early signs of a market bottoming, but after a long winter, any rays of sunshine are welcome.
As the chart here shows, after spiking outrageously during the stimulus fuelled pandemic days, the total value of housing loans slid just as famously, to crunch in January 2023.
Backing in the argument there has been the beginnings of a new phase of the housing market, there has been some stability in recent months in the relative value of loans, between the different housing formats.
As the chart below shows, Owner-Occupier loans for New Construction were 2.5% higher in June, while Investor loans were 2.6% higher. Modest increases from which an industry can establish a new foothold.

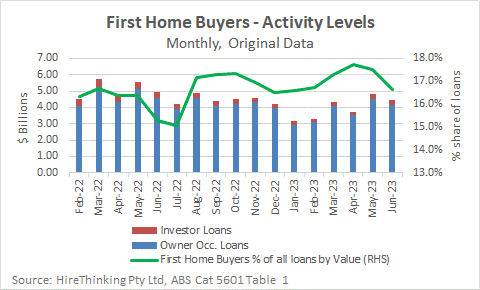
Thanks largely to the sharp rise in interest rates and the challenges of getting invested, First home buyers continue to be hammered and that is showing through in their loan values.
Their share of loans by value for June was 16.6%, well down on the peak in January 2021, when their share by value was 26.3%.
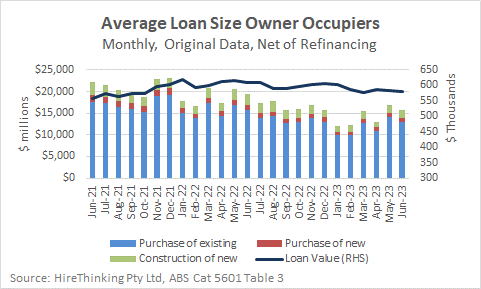
Again, reflecting the impact of interest rate rises and affordability of housing, the average size of all loans in June was $580,240 falling to a level not seen since October 2021. This data may be more important than we think because we also know the cost of building has increased. If costs are higher and loans are smaller, could we be seeing smaller dwellings being transacted and built?
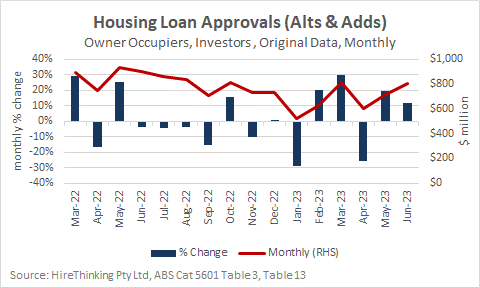
While it is clearly tough going on new builds, loans for alterations and additions continued to be in positive territory, up 11.9% for June. This could be the long overhang of work coming to an end, with GWA Group (the largest supplier of kitchen and bathroom products) expecting the renovations segment to remain subdued until at least the middle of next year.
The refinancing of low fixed rate loans issued under COVID 19 stimulus measures is now well underway. The good news is that so far, the much speculated ‘mortgage cliff’ has not eventuated.
In reporting their results, the Commonwealth Bank of Australia commented that with interest rates at current levels, around 3.5% of owner-occupied mortgages written in the past five years, are in negative cash flow, where the borrower’s disposable income is insufficient to cover loan repayments and standard household expenses.
This is well below forecasts that 15% of home loan borrowers could find themselves with negative cash flow by the end of the year.
Moreover, the CBA reported that most of the negative cash flow loans could turn around by a 10% cut in household expenditure, many were covered with mortgage insurance – good for the bank, not so much the borrower – and a large portion having less than 80% leverage, meaning they have relatively sound equity to rely on.
Still, as the chart below shows, refinancing is at record levels and though it is flattening out, the ‘mortgage cliff’ will have plenty of borrowers looking around right now.
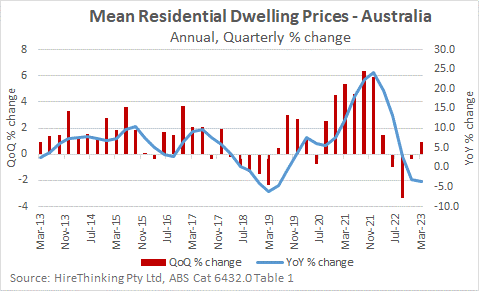
As discussed in previous issues of Stats Count, there is a strong link between housing finance and house prices. The March quarter shows housing prices were up a pretty modest 1.0%, which ties in with the earlier discussion of the rate of decline in housing finance easing during the period. House prices have probably turned the corner, but there is way to go yet before auctioneers can really blow their minds and burst our ear drums.
Overlaying the two data sets – average dwelling prices and housing finance – we can observe the uptick in housing finance may be a precursor to some strengthening of house prices. While this is a possibility, it could be too soon to tell because we still have interest rate rises to flow through to mortgage holders which may dampen the upwards momentum around pricing.
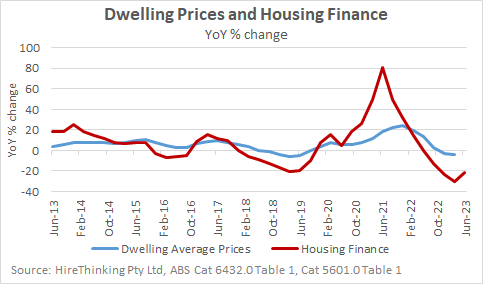
As The Guardian’s Greg Jericho observed, the level of housing finance right now is almost exactly where it was pre-pandemic, in mid-2019. The only way is up?

")

")
