
Plywood imports rose 19.6% to total 489,396 m3 in 2025, an annual rise of more than 80,000 m3. Over the year, especially in the second half, the weighted average price deteriorated to the point the annual weighted average price fell to 6.0% for the year. In 2025, the weighted average price for all imports of plywood was AUDFob869.80.
Analysis of ABS data shows the total value of plywood imports was AUDFob425.5 million. The landed value was AUDCif460.5 million.
These imports do not include plywood-backed material like that used for flooring, wafer, batten, and other board products that are mingled into traditional plywood definitions.
The chart below displays the import experience for the last two years.
Australian Plywood Imports: Jan ’24 – Dec ’25 (m3 & AUDFob/m3)

Source: ABS and IndustryEdge
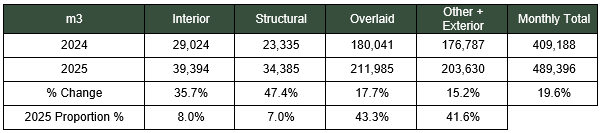
The table below shows annual Plywood imports, by main grade, for 2025, compared with the prior year.
Australian Plywood Imports by Main Grade: 2024 v 2025 (m3)
PLY2
Over the course of 2025, the weighted average price of plywood imports deteriorated, except for the ‘catch all’ classification described as ‘Other’. The result, as shown in the table below, was that by the end of 2025, the weighted average import price for all plywood was 6.0% lower than in 2024.
Australian Plywood Imports by Main Grade: 2024 v 2025 (AUDFob/m3)
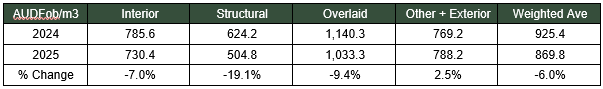
Lower prices and sharply higher volumes fed into an increase in import value, which lifted 12.4% to AUDFob425.5 million in 2025, just AUD0.5 million below the all time record booked in 2022 when pandemic-era disruptions drive materials prices sharply higher.
China dominates import supply
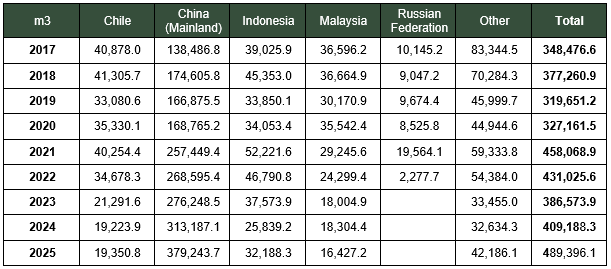
China has long been the main supplier of plywood into Australia. In 2017, its shipments accounted for just less than 40% of total imports. In 2025, China’s share had almost doubled to a dominant 77.7% or 379,244 m3.
Other suppliers of note, detailed in the table below, all play specific roles in the market, with softwood (eg. Chile), Hardwood (eg. Malaysia) and Tropical (eg. Indonesia) species faced plywoods being delivered by different countries.
Australian Plywood Imports by Country: 2017 – 2025 (m3)
The chart below shows plywood imports from China, with all other countries reported combined.
Australian Plywood Imports: China v Other: 2017 – 2025 (m3 & %)

Source: ABS and IndustryEdge
Although overly busy, the price chart below makes one important point: The weighted average price (black dotted) is driven entirely by the price from China (red). This is an expected result when one country dominates supply.
Australian Plywood Imports by Country: 2017 – 2025 (AUDFob/m3)

Source: ABS and IndustryEdge
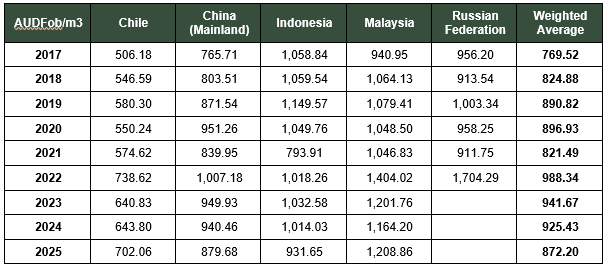
The table displays weighted average plywood import prices for each country.
Australian Plywood Imports by Country: 2017 – 2025 (AUDFob/m3)

")
")
